Gala Precis. Eng

  • Market Cap: Micro Cap
  • Industry: Industrial Manufacturing
  • ISIN: INE0RE001014
  • NSEID: GALAPREC
  • BSEID: 544244
INR
922.95
31.45 (3.53%)
BSENSE

Jun 11, 03:30 PM

BSE+NSE Vol: 27.81 k

  • Price Points
  • Score
  • Mojo Parameters
  • Total Return
  • News and Corporate Actions
  • Key factors
  • Shareholding
  • Financials
  • CompanyCV
stock-summaryPrice Point
High/Low

1Day

52 Week

Valuation
Technical
Day's Volume

CASH

27.81 k (62.62%) Volume

Shareholding (Mar 2026)

FII

1.30%

Held by 4 FIIs

DII

5.46%

Held by 0 DIIs

Promoter

54.99%

Why is Gala Precision Engineering Ltd falling/rising?

11-Jun-2026

As of 10-Jun, the stock price of Gala Precision Engineering Ltd is Rs 891.50, down 1.6% today and underperforming its sector. Despite a year-to-date gain of 15.24%, declining investor participation and recent intraday lows indicate short-term challenges for the stock.

As of 10-Jun, the stock price of Gala Precision Engineering Ltd is currently at Rs 891.50, reflecting a decline of Rs 14.5 or 1.6%. This decrease is evident as the stock has underperformed its sector by 0.57% today. The stock reached an intraday low of Rs 886.55, which is a drop of 2.15% from its previous value. <BR><BR>Despite a positive performance over the past week and month, with increases of 1.84% and 3.92% respectively, the stock has shown a year-to-date gain of 15.24%, significantly outperforming the Sensex, which has declined by 13.19% in the same period. However, the stock has experienced a year-over-year decline of 5.41%, indicating some longer-term challenges.<BR><BR>Investor participation appears to be declining, as evidenced by a substantial drop in delivery volume, which fell by 61.98% compared to the 5-day average. This reduced interest from investors may contribute to the current downward pressure on the stock price. Additionally, while the stock is trading above its 20-day, 50-day, 100-day, and 200-day moving averages, it is below its 5-day moving average, suggesting a short-term weakness in momentum.<BR><BR>Overall, the combination of falling investor participation, today's underperformance relative to the sector, and the recent intraday low are key factors contributing to the decline in Gala Precision Engineering Ltd's stock price.

View full answer

What does Gala Precis. Eng do?

11-Jun-2026

Gala Precision Engineering Ltd is a micro-cap industrial manufacturing company, incorporated in 2009 and publicly listed in 2023, with recent net sales of 95 Cr and net profit of 12 Cr as of March 2026. Key financial metrics include a P/E ratio of 31.00 and a market cap of INR 1,139 Cr.

Overview: <BR>Gala Precision Engineering Ltd operates in the industrial manufacturing sector and is classified as a micro-cap company.<BR><BR>History: <BR>The company was incorporated in 2009 as Gala Precision Engineering Private Limited and later converted into a public company, changing its name to Gala Precision Engineering Limited on October 25, 2023. The most recent quarterly results reported net sales and net profit for the period ending March 2026.<BR><BR>Financial Snapshot: <BR>Most recent Net Sales: 95 Cr (Quarterly Results - Mar 2026) <BR>Most recent Net Profit: 12 Cr (Quarterly Results - Mar 2026) <BR>Market-cap value: INR 1,139 Cr (Micro Cap)<BR><BR>Key Metrics: <BR>P/E: 31.00 <BR>Industry P/E: 37 <BR>Dividend Yield: 0.00% <BR>Debt-Equity: -0.04 <BR>Return on Equity: 12.41% <BR>Price to Book: 3.91 <BR><BR>Contact Details: <BR>Registrar Address: Not available. <BR>Phone: N/A <BR>Email: N/A <BR>Website: N/A

View full answer

How big is Gala Precis. Eng?

11-Jun-2026

As of 10th June, Gala Precision Engineering Ltd has a market capitalization of 1,139.00 Cr, with recent Net Sales of 314.30 Cr and a Net Profit of 35.48 Cr.

As of 10th June, Gala Precision Engineering Ltd has a market capitalization of 1,139.00 Cr and is classified as a Micro Cap company.<BR><BR>In the latest four quarters, the company reported Net Sales of 314.30 Cr and a Net Profit of 35.48 Cr.<BR><BR>The latest annual period for the balance sheet is March 2025, with Shareholder's Funds amounting to 256.61 Cr and Total Assets of 319.66 Cr.

View full answer

Who are the peers of the Gala Precis. Eng?

11-Jun-2026

Gala Precis. Eng's peers include Indian Hume Pipe, Everest Kanto, and Rajoo Engineers, among others. It has average management risk and good growth, with a 1-year return of -2.27%, outperforming some peers like Indian Hume Pipe and Everest Kanto.

Peers: The peers of Gala Precis. Eng are Indian Hume Pipe, Everest Kanto, Salasar Techno, MIC Electronics, Rajoo Engineers, Eimco Elecon(I), Mamata Machinery, ICE Make Refrig., Macpower CNC, and OBSC Perfection.<BR><BR>Quality Snapshot: Excellent management risk is observed at Everest Kanto, Rajoo Engineers, Eimco Elecon(I), Mamata Machinery, ICE Make Refrig., Macpower CNC, and OBSC Perfection, while Average management risk is found at Indian Hume Pipe, Salasar Techno, Gala Precis. Eng, and the rest. Growth is rated as Excellent for Rajoo Engineers, while Good growth is noted for Gala Precis. Eng, MIC Electronics, Eimco Elecon(I), ICE Make Refrig., and Macpower CNC, and the rest show Below Average growth. Capital Structure is Excellent for Everest Kanto, Gala Precis. Eng, Eimco Elecon(I), Mamata Machinery, ICE Make Refrig., Macpower CNC, and OBSC Perfection, while Below Average is found at Indian Hume Pipe, Salasar Techno, and MIC Electronics, and the rest.<BR><BR>Return Snapshot: Gala Precis. Eng has a 1-year return of -2.27%, which is better than Indian Hume Pipe at -36.40%, the lowest, and Everest Kanto at -22.91%, the highest. The peers with negative six-month returns include Indian Hume Pipe, Salasar Techno, MIC Electronics, Rajoo Engineers, and Mamata Machinery.

View full answer

Should I buy, sell or hold Gala Precision Engineering Ltd?

09-Jun-2026

Are Gala Precision Engineering Ltd latest results good or bad?

06-Feb-2026

Gala Precision Engineering Ltd's latest results show strong revenue growth of 19.38% quarter-over-quarter and 46.68% year-on-year, reaching ₹85.25 crores. However, net profit declined slightly by 0.95% from the previous quarter, and operating margins decreased, indicating potential challenges in maintaining profitability.

Gala Precision Engineering Ltd's latest results present a mixed picture. On one hand, the company achieved record revenue of ₹85.25 crores for the quarter ended December 2025, reflecting a significant 19.38% increase from the previous quarter and a remarkable 46.68% year-on-year growth. This strong revenue performance indicates robust demand for their precision engineering products.<BR><BR>However, the profitability aspect raises concerns. The net profit for the quarter was ₹8.31 crores, which, while showing a healthy year-on-year increase of 57.09%, marked a slight decline of 0.95% compared to the previous quarter. Additionally, the operating margin decreased to 17.09% from 18.31% in the same quarter last year, suggesting challenges in maintaining profitability amidst rising operational costs.<BR><BR>Overall, while the revenue growth is impressive, the decline in operating margins and net profit compared to the previous quarter indicates potential operational challenges that could affect future profitability. Investors may need to watch how the company manages these issues moving forward.

View full answer

Is Gala Precis. Eng technically bullish or bearish?

29-Nov-2025

As of November 28, 2025, the market trend is mildly bearish, with bearish indicators outweighing bullish ones despite some mild bullish signals from the MACD and OBV.

As of 28 November 2025, the technical trend has changed from bearish to mildly bearish. The current stance is mildly bearish, with key indicators supporting this view. The MACD on a weekly basis is mildly bullish, but the moving averages and Bollinger Bands on the daily and weekly time frames indicate a mildly bearish sentiment. The KST is bearish on the weekly, and Dow Theory also reflects a mildly bearish stance on both weekly and monthly time frames. The OBV shows mild bullishness on both weekly and monthly, but overall, the bearish indicators outweigh the bullish ones.

View full answer

How has been the historical performance of Gala Precis. Eng?

13-Nov-2025

Gala Precis. Eng has shown consistent growth in net sales and profits over the past three years, with net sales reaching 237.83 Cr in March 2025, up from 202.55 Cr in March 2024 and 165.47 Cr in March 2023. Profit after tax also increased to 26.82 Cr in March 2025, reflecting strong financial performance despite a decline in cash flow from operating activities.

Answer:<BR>The historical performance of Gala Precis. Eng shows a consistent growth trend in net sales and profits over the past three years.<BR><BR>Breakdown:<BR>Gala Precis. Eng reported net sales of 237.83 Cr in March 2025, up from 202.55 Cr in March 2024 and 165.47 Cr in March 2023, indicating a strong upward trajectory in revenue. The total operating income mirrored this growth, reaching 237.83 Cr in March 2025. The company's total expenditure also increased, totaling 197.04 Cr in March 2025, compared to 163.79 Cr in March 2024 and 138.14 Cr in March 2023. Operating profit, excluding other income, rose to 40.79 Cr in March 2025 from 38.76 Cr in March 2024 and 27.33 Cr in March 2023, while the overall operating profit, including other income, reached 45.17 Cr in March 2025. Profit before tax increased to 33.13 Cr in March 2025, up from 25.28 Cr in March 2024 and 27.46 Cr in March 2023, leading to a profit after tax of 26.82 Cr in March 2025, compared to 21.99 Cr in March 2024 and 24.21 Cr in March 2023. The company's total assets grew significantly to 319.66 Cr in March 2025 from 188.68 Cr in March 2024, while total liabilities also increased to 319.66 Cr in March 2025, reflecting a rise in both assets and liabilities. The cash flow from operating activities showed a decline to 2.00 Cr in March 2025 from 15.00 Cr in March 2024, but cash flow from financing activities surged to 89.00 Cr in March 2025, indicating a shift in funding strategies.

View full answer

Is Gala Precis. Eng overvalued or undervalued?

14-Oct-2025

As of October 13, 2025, Gala Precis. Eng is considered overvalued with a valuation grade of expensive, reflected by a PE ratio of 35.95 and underperformance of -41.51% year-to-date compared to the Sensex's 5.36%.

As of 13 October 2025, the valuation grade for Gala Precis. Eng has moved from very expensive to expensive. The company is currently considered overvalued based on its financial ratios. The PE ratio stands at 35.95, while the EV to EBITDA ratio is 23.94, and the EV to Sales ratio is 3.82, indicating a premium compared to its peers.<BR><BR>In comparison to notable competitors, Thermax has a significantly higher PE ratio of 56.82 and an EV to EBITDA of 37.43, while Action Construction Equipment shows a lower PE of 30.37 and an EV to EBITDA of 24.85. This suggests that Gala Precis. Eng is trading at a high valuation relative to its industry peers. Additionally, the company's recent stock performance has underperformed the Sensex, with a year-to-date return of -41.51% compared to the Sensex's 5.36%, reinforcing the view that it is overvalued in the current market context.

View full answer

When is the next results date for Gala Precis. Eng?

31-Jul-2025

Gala Precis. Eng will announce its results on 05 August 2025.

Gala Precis. Eng will declare its results on 05 August 2025.

View full answer

Who are the top shareholders of the Gala Precis. Eng?

06-Jun-2025

The top shareholder of Gala Precis. Eng is Kirit Vishanji Gala, with a 21.98% stake. Promoters primarily own the company, with Pooja Unichem LLP as the largest public shareholder at 5.2%, and individual investors holding 23.91% of shares.

The top shareholders of Gala Precis. Eng include Kirit Vishanji Gala, who holds the highest stake at 21.98%. The company is primarily held by promoters, with no pledged promoter holdings. In terms of public shareholders, Pooja Unichem LLP is the largest, owning 5.2%. Additionally, individual investors collectively hold 23.91% of the shares, while 8 Foreign Institutional Investors (FIIs) hold 1.32% of the company.

View full answer

Has Gala Precis. Eng declared dividend?

06-Jun-2025

No Dividend History Available

iScoreScore
Click here to find our call on this stock
Strong Sell
Sell
Hold
Buy
Strong Buy

Dashboard

1

The company is Net-Debt Free

 
2

Healthy long term growth as Operating profit has grown by an annual rate 31.13%

 
3

With a growth in Net Profit of 47.35%, the company declared Very Positive results in Mar 26

stock-summaryMojo Parameters

Mojo Parameters

Loading Valuation Snapshot...

Stock DNA

stock-summary
Industry

Industrial Manufacturing

stock-summary
Market cap

INR 1,151 Cr (Micro Cap)

stock-summary
P/E

33.00

stock-summary
Industry P/E

37

stock-summary
Dividend Yield

0.00%

stock-summary
Debt Equity

-0.04

stock-summary
Return on Equity

12.41%

stock-summary
Price to Book

3.90

Revenue and Profits:
Net Sales:
95 Cr
(Quarterly Results - Mar 2026)
Net Profit:
12 Cr
stock-summaryTotal Returns
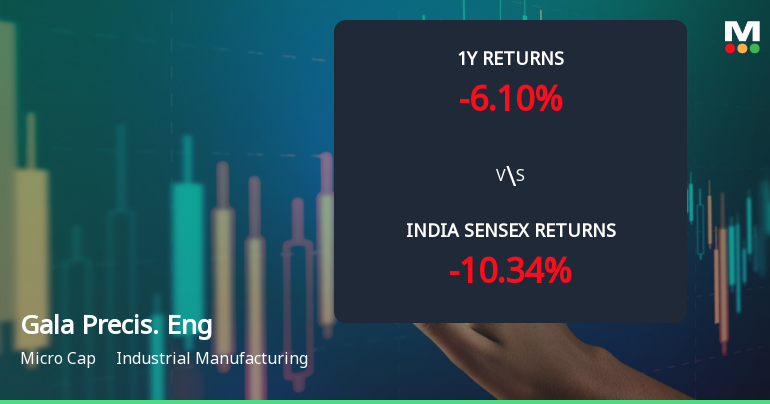
Total Returns (Price + Dividend) stock-summary
Dividend Yield (0%)
TimePeriod
Price Return
Dividend Return
Total Return
3 Months
25.57%
0%
25.57%
6 Months
25.69%
0%
25.69%
1 Year
-0.76%
0%
-0.76%
2 Years
0%
0%
0.0%
3 Years
0%
0%
0.0%
4 Years
0%
0%
0.0%
5 Years
0%
0%
0.0%

Gala Precis. Eng for the last several years.

Risk Adjusted Returns v/s stock-summary
Returns Beta
Icon
Beta has not been calculated since enough price history is not available
stock-summaryNews & Corporate Actions

Announcements stock-summary

Announcement under Regulation 30 (LODR)-Newspaper Publication

09-Jun-2026 | Source : BSE

Please find newspaper post after dispatching annual report to shareholder

Compliance Under Regulation 36 (1) (B) Of The SEBI (Listing Obligations And Disclosure Requirements) Regulations 2015

08-Jun-2026 | Source : BSE

Please find the same

Announcement under Regulation 30 (LODR)-Newspaper Publication

08-Jun-2026 | Source : BSE

Newspaper Publication prior to AGM Notice

Corporate Actions stock-summary

stock-summary
BOARD MEETING

No Upcoming Board Meetings

stock-summary
DIVIDEND

No Dividend history available

stock-summary
SPLITS

No Splits history available

stock-summary
BONUS

No Bonus history available

stock-summary
RIGHTS

No Rights history available

stock-summaryKey Factors

Quality key factors stock-summary

Factor
Value
Sales Growth (5y)
21.60%
EBIT Growth (5y)
31.13%
EBIT to Interest (avg)
9.50
Debt to EBITDA (avg)
0.79
Net Debt to Equity (avg)
-0.04
Sales to Capital Employed (avg)
0.96
Tax Ratio
18.30%
Dividend Payout Ratio
0
Pledged Shares
0
Institutional Holding
6.76%
ROCE (avg)
17.94%
ROE (avg)
11.47%

Valuation key factors

Factor
Value
P/E Ratio
33
Industry P/E
37
Price to Book Value
4.04
EV to EBIT
28.04
EV to EBITDA
22.54
EV to Capital Employed
4.17
EV to Sales
3.72
PEG Ratio
0.97
Dividend Yield
NA
ROCE (Latest)
14.87%
ROE (Latest)
12.41%

Technicals key factors

Indicator
Weekly
Monthly
MACD
Bullish
RSI
No Signal
No Signal
Bollinger Bands
Bullish
Mildly Bullish
Moving Averages
Bullish (Daily)
KST
Bullish
Dow Theory
No Trend
No Trend
OBV
No Trend
No Trend
stock-summary Technical Indicator Scale: Bearish, Mildly Bearish, Sideways, Mildly Bullish, Bullish  Turned 
stock-summaryShareholding
Shareholding Snapshot : Mar 2026stock-summary
Shareholding Compare (%holding) stock-summary
Majority shareholders

Promoters

Pledged Promoter Holdings

None

Mutual Funds

Held by 0 Schemes

FIIs

Held by 4 FIIs (1.3%)

Promoter with highest holding

Kirit Vishanji Gala (21.84%)

Highest Public shareholder

Pooja Unichem Llp (5.16%)

Individual Investors Holdings

23.7%

stock-summaryFinancial
[
  {
    "link": "quarterly",
    "btn_text": "All Quarterly Results",
    "header": "Quarterly Results Snapshot (Consolidated) - Mar'26 - QoQ",
    "rhs": [
      {
        "prefix": "Net Sales ",
        "suffix": "QoQ Growth in quarter ended Mar 2026 is 10.92% vs 19.38% in Dec 2025",
        "dir": -1
      },
      {
        "prefix": "Consolidated Net Profit ",
        "suffix": "QoQ Growth in quarter ended Mar 2026 is 47.29% vs -0.95% in Dec 2025",
        "dir": 1
      }
    ],
    "table": {
      "header": [
        "Mar'26",
        "Dec'25",
        "Change(%)"
      ],
      "body": [
        {
          "field": "Net Sales",
          "val1": "94.56",
          "val2": "85.25",
          "chgp": "10.92%",
          "chgp_class": "positive"
        },
        {
          "field": "Operating Profit (PBDIT) excl Other Income",
          "val1": "16.60",
          "val2": "14.57",
          "chgp": "13.93%",
          "chgp_class": "positive"
        },
        {
          "field": "Interest",
          "val1": "0.94",
          "val2": "0.77",
          "chgp": "22.08%",
          "chgp_class": "negative"
        },
        {
          "field": "Exceptional Items",
          "val1": "0.05",
          "val2": "-1.05",
          "chgp": "104.76%",
          "chgp_class": "positive"
        },
        {
          "field": "Consolidate Net Profit",
          "val1": "12.24",
          "val2": "8.31",
          "chgp": "47.29%",
          "chgp_class": "positive"
        },
        {
          "field": "Operating Profit Margin (Excl OI)",
          "val1": "17.55%",
          "val2": "17.09%",
          "chgp": "0.46%",
          "chgp_class": "positive"
        }
      ]
    }
  },
  {
    "link": "half-yearly",
    "btn_text": "All Half Yearly Results",
    "header": "Half Yearly Results Snapshot (Consolidated) - Sep'25",
    "rhs": [
      {
        "prefix": "Net Sales ",
        "suffix": " Growth in half year ended Sep 2025 is 28.82% vs 9.11% in Sep 2024",
        "dir": 1
      },
      {
        "prefix": "Consolidated Net Profit ",
        "suffix": " Growth in half year ended Sep 2025 is 29.26% vs 20.31% in Sep 2024",
        "dir": 1
      }
    ],
    "table": {
      "header": [
        "Sep'25",
        "Sep'24",
        "Change(%)"
      ],
      "body": [
        {
          "field": "Net Sales",
          "val1": "134.49",
          "val2": "104.40",
          "chgp": "28.82%",
          "chgp_class": "positive"
        },
        {
          "field": "Operating Profit (PBDIT) excl Other Income",
          "val1": "20.74",
          "val2": "20.25",
          "chgp": "2.42%",
          "chgp_class": "positive"
        },
        {
          "field": "Interest",
          "val1": "1.13",
          "val2": "2.32",
          "chgp": "-51.29%",
          "chgp_class": "positive"
        },
        {
          "field": "Exceptional Items",
          "val1": "-0.13",
          "val2": "-0.14",
          "chgp": "7.14%",
          "chgp_class": "positive"
        },
        {
          "field": "Consolidate Net Profit",
          "val1": "14.93",
          "val2": "11.55",
          "chgp": "29.26%",
          "chgp_class": "positive"
        },
        {
          "field": "Operating Profit Margin (Excl OI)",
          "val1": "15.42%",
          "val2": "19.40%",
          "chgp": "-3.98%",
          "chgp_class": "negative"
        }
      ]
    }
  },
  {
    "link": "nine-monthly",
    "btn_text": "All Nine Monthly Results",
    "header": "Nine Monthly Results Snapshot (Consolidated) - Dec'25",
    "rhs": [
      {
        "prefix": "Net Sales ",
        "suffix": "YoY Growth in nine months ended Dec 2025 is 35.21% vs 11.97% in Dec 2024",
        "dir": 1
      },
      {
        "prefix": "Consolidated Net Profit ",
        "suffix": "YoY Growth in nine months ended Dec 2025 is 38.00% vs 8.65% in Dec 2024",
        "dir": 1
      }
    ],
    "table": {
      "header": [
        "Dec'25",
        "Dec'24",
        "Change(%)"
      ],
      "body": [
        {
          "field": "Net Sales",
          "val1": "219.74",
          "val2": "162.52",
          "chgp": "35.21%",
          "chgp_class": "positive"
        },
        {
          "field": "Operating Profit (PBDIT) excl Other Income",
          "val1": "35.31",
          "val2": "27.96",
          "chgp": "26.29%",
          "chgp_class": "positive"
        },
        {
          "field": "Interest",
          "val1": "1.90",
          "val2": "2.89",
          "chgp": "-34.26%",
          "chgp_class": "positive"
        },
        {
          "field": "Exceptional Items",
          "val1": "-1.18",
          "val2": "-0.20",
          "chgp": "-490.00%",
          "chgp_class": "negative"
        },
        {
          "field": "Consolidate Net Profit",
          "val1": "23.24",
          "val2": "16.84",
          "chgp": "38.00%",
          "chgp_class": "positive"
        },
        {
          "field": "Operating Profit Margin (Excl OI)",
          "val1": "16.07%",
          "val2": "17.20%",
          "chgp": "-1.13%",
          "chgp_class": "negative"
        }
      ]
    }
  },
  {
    "link": "annual",
    "btn_text": "All Annual Results",
    "header": "Annual Results Snapshot (Consolidated) - Mar'26",
    "rhs": [
      {
        "prefix": "Net Sales ",
        "suffix": "YoY Growth in year ended Mar 2026 is 32.15% vs 17.42% in Mar 2025",
        "dir": 1
      },
      {
        "prefix": "Consolidated Net Profit ",
        "suffix": "YoY Growth in year ended Mar 2026 is 32.14% vs 20.24% in Mar 2025",
        "dir": 1
      }
    ],
    "table": {
      "header": [
        "Mar'26",
        "Mar'25",
        "Change(%)"
      ],
      "body": [
        {
          "field": "Net Sales",
          "val1": "314.30",
          "val2": "237.84",
          "chgp": "32.15%",
          "chgp_class": "positive"
        },
        {
          "field": "Operating Profit (PBDIT) excl Other Income",
          "val1": "51.92",
          "val2": "40.79",
          "chgp": "27.29%",
          "chgp_class": "positive"
        },
        {
          "field": "Interest",
          "val1": "2.84",
          "val2": "3.80",
          "chgp": "-25.26%",
          "chgp_class": "positive"
        },
        {
          "field": "Exceptional Items",
          "val1": "-1.13",
          "val2": "-0.26",
          "chgp": "-334.62%",
          "chgp_class": "negative"
        },
        {
          "field": "Consolidate Net Profit",
          "val1": "35.48",
          "val2": "26.85",
          "chgp": "32.14%",
          "chgp_class": "positive"
        },
        {
          "field": "Operating Profit Margin (Excl OI)",
          "val1": "16.52%",
          "val2": "17.15%",
          "chgp": "-0.63%",
          "chgp_class": "negative"
        }
      ]
    }
  }
]

Quarterly Results Snapshot (Consolidated) - Mar'26 - QoQstock-summary

Mar'26
Dec'25
Change(%)
Net Sales
94.56
85.25
10.92%
Operating Profit (PBDIT) excl Other Income
16.60
14.57
13.93%
Interest
0.94
0.77
22.08%
Exceptional Items
0.05
-1.05
104.76%
Consolidate Net Profit
12.24
8.31
47.29%
Operating Profit Margin (Excl OI)
17.55%
17.09%
0.46%
Values in Rs Cr.
Direction Arrows
Net Sales

QoQ Growth in quarter ended Mar 2026 is 10.92% vs 19.38% in Dec 2025

Direction Arrows
Consolidated Net Profit

QoQ Growth in quarter ended Mar 2026 is 47.29% vs -0.95% in Dec 2025

Half Yearly Results Snapshot (Consolidated) - Sep'25stock-summary

Sep'25
Sep'24
Change(%)
Net Sales
134.49
104.40
28.82%
Operating Profit (PBDIT) excl Other Income
20.74
20.25
2.42%
Interest
1.13
2.32
-51.29%
Exceptional Items
-0.13
-0.14
7.14%
Consolidate Net Profit
14.93
11.55
29.26%
Operating Profit Margin (Excl OI)
15.42%
19.40%
-3.98%
Values in Rs Cr.
Direction Arrows
Net Sales

Growth in half year ended Sep 2025 is 28.82% vs 9.11% in Sep 2024

Direction Arrows
Consolidated Net Profit

Growth in half year ended Sep 2025 is 29.26% vs 20.31% in Sep 2024

Nine Monthly Results Snapshot (Consolidated) - Dec'25stock-summary

Dec'25
Dec'24
Change(%)
Net Sales
219.74
162.52
35.21%
Operating Profit (PBDIT) excl Other Income
35.31
27.96
26.29%
Interest
1.90
2.89
-34.26%
Exceptional Items
-1.18
-0.20
-490.00%
Consolidate Net Profit
23.24
16.84
38.00%
Operating Profit Margin (Excl OI)
16.07%
17.20%
-1.13%
Values in Rs Cr.
Direction Arrows
Net Sales

YoY Growth in nine months ended Dec 2025 is 35.21% vs 11.97% in Dec 2024

Direction Arrows
Consolidated Net Profit

YoY Growth in nine months ended Dec 2025 is 38.00% vs 8.65% in Dec 2024

Annual Results Snapshot (Consolidated) - Mar'26stock-summary

Mar'26
Mar'25
Change(%)
Net Sales
314.30
237.84
32.15%
Operating Profit (PBDIT) excl Other Income
51.92
40.79
27.29%
Interest
2.84
3.80
-25.26%
Exceptional Items
-1.13
-0.26
-334.62%
Consolidate Net Profit
35.48
26.85
32.14%
Operating Profit Margin (Excl OI)
16.52%
17.15%
-0.63%
Values in Rs Cr.
Direction Arrows
Net Sales

YoY Growth in year ended Mar 2026 is 32.15% vs 17.42% in Mar 2025

Direction Arrows
Consolidated Net Profit

YoY Growth in year ended Mar 2026 is 32.14% vs 20.24% in Mar 2025

stock-summaryCompany CV
About Gala Precision Engineering Ltd stock-summary
stock-summary
Gala Precision Engineering Ltd
Micro Cap
Industrial Manufacturing
Gala Precision Engineering Limited was incorporated as `Gala Precision Engineering Private Limited' a Private Limited Company, pursuant to the Certificate of Incorporation issued by the RoC on February 23, 2009. The name of the Company was changed to `Gala Precision Engineering Limited', upon conversion into a Public Company,and a fresh Certificate of Change of Name was issued on October 25, 2023 by the RoC.
Company Coordinates stock-summary
Icon
No Company Details Available