
Compare Galada Finance with Similar Stocks
Stock DNA
Non Banking Financial Company (NBFC)
INR 8 Cr (Micro Cap)
17.00
20
0.00%
1.94
6.91%
1.21
Total Returns (Price + Dividend) 
Galada Finance for the last several years.
Risk Adjusted Returns v/s
Returns Beta

News

Galada Finance Ltd Downgraded to Sell Amid Mixed Financial and Technical Signals
Galada Finance Ltd, a micro-cap player in the Non Banking Financial Company (NBFC) sector, has seen its investment rating downgraded from Hold to Sell as of 9 June 2026. This shift reflects a complex interplay of factors including deteriorating technical indicators, modest financial trends, valuation considerations, and concerns over long-term quality metrics.
Read full news article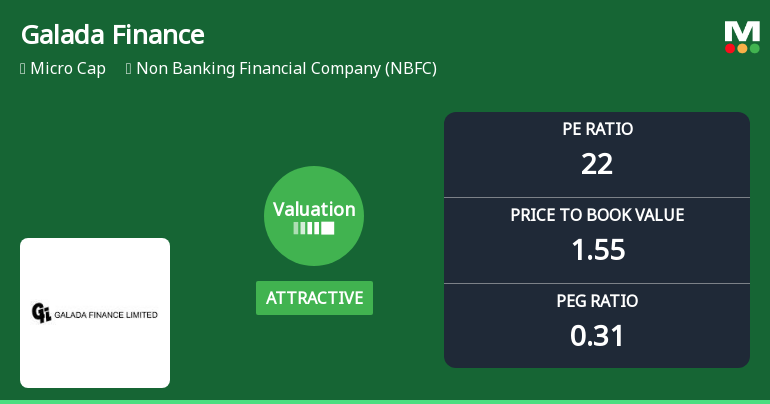
Galada Finance Ltd Valuation Shifts to Attractive Amid Mixed Market Performance
Galada Finance Ltd, a micro-cap player in the Non Banking Financial Company (NBFC) sector, has witnessed a notable shift in its valuation parameters, moving from an expensive to an attractive territory. This change comes amid a backdrop of mixed market performance and evolving investor sentiment, prompting a reassessment of the stock’s price attractiveness relative to its historical and peer benchmarks.
Read full news article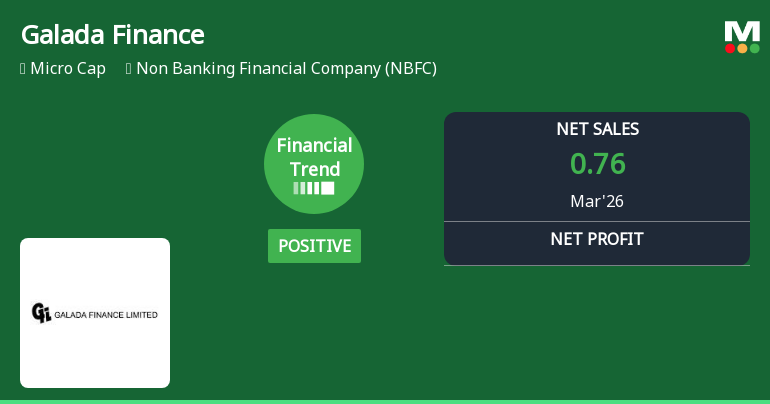
Galada Finance Ltd Reports Strong Quarterly Turnaround Amid NBFC Sector Challenges
Galada Finance Ltd, a micro-cap player in the Non Banking Financial Company (NBFC) sector, has demonstrated a marked improvement in its financial performance for the quarter ended March 2026. The company’s financial trend has shifted from flat to positive, reflecting robust growth in key profitability metrics and signalling a potential turnaround after a period of subdued results.
Read full news article Announcements
Announcement under Regulation 30 (LODR)-Newspaper Publication
01-Jun-2026 | Source : BSENewspaper Publication
Board Meeting Outcome for Outcome Of Board Meeting Of The Company Held On 28Th May 2026
28-May-2026 | Source : BSEWith reference to the above we would like to inform you that the Board of Directors of the company has considered and approved the following matters:- 1. Considered approved and taken on record the Audited Financial results for the quarter and the year ended 31st March 2O26 and Statement of Assets & Liabilities for the year ended 31st March 2026 and Cash Flow Statement for the year ended 31st March 2026 a copy of which is enclosed for kind reference; 2. Auditors Report on Quarterly Financial Results and Year to Date Results of the Company Pursuant to Regulation 33 of the SEBI (Listing Obligations and Disclosure Requirements) Regulations 2015.
Financial Results 31.03.2026
28-May-2026 | Source : BSEFinancial Results 31.03.2026
Corporate Actions

No Upcoming Board Meetings

No Dividend history available

No Splits history available

No Bonus history available

No Rights history available
Quality key factors
Valuation key factors
Technicals key factors
 Technical Indicator Scale: Bearish, Mildly Bearish, Sideways, Mildly Bullish, Bullish Turned
 Shareholding Snapshot : Mar 2026
Shareholding Compare (%holding)
Promoters
None
Held by 0 Schemes
Held by 0 FIIs
Naveen Galada (15.51%)
Abhay K (2.48%)
28.16%
Quarterly Results Snapshot (Standalone) - Mar'26 - YoY

YoY Growth in quarter ended Mar 2026 is 40.74% vs 12.50% in Mar 2025
YoY Growth in quarter ended Mar 2026 is 46.67% vs -25.00% in Mar 2025
Half Yearly Results Snapshot (Standalone) - Sep'25
Growth in half year ended Sep 2025 is 54.05% vs 48.00% in Sep 2024
Growth in half year ended Sep 2025 is 71.43% vs -30.00% in Sep 2024
Nine Monthly Results Snapshot (Standalone) - Dec'25
YoY Growth in nine months ended Dec 2025 is 64.29% vs 28.74% in Dec 2024
YoY Growth in nine months ended Dec 2025 is 120.00% vs -28.57% in Dec 2024
Annual Results Snapshot (Standalone) - Mar'26
YoY Growth in year ended Mar 2026 is 57.58% vs 23.13% in Mar 2025
YoY Growth in year ended Mar 2026 is 76.00% vs -26.47% in Mar 2025
About Galada Finance Ltd

Company Coordinates


