
Compare Galaxy Agrico with Similar Stocks
Dashboard
With a Operating Losses, the company has a Weak Long Term Fundamental Strength
- Company's ability to service its debt is weak with a poor EBIT to Interest (avg) ratio of -0.54
- The company has been able to generate a Return on Equity (avg) of 2.95% signifying low profitability per unit of shareholders funds
Flat results in Mar 26
Risky - Negative EBITDA
Reducing Promoter Confidence
Stock DNA
Industrial Manufacturing
INR 115 Cr (Micro Cap)
NA (Loss Making)
49
0.00%
0.00
-2.62%
1.97
Total Returns (Price + Dividend) 
Galaxy Agrico for the last several years.
Risk Adjusted Returns v/s
Returns Beta

News
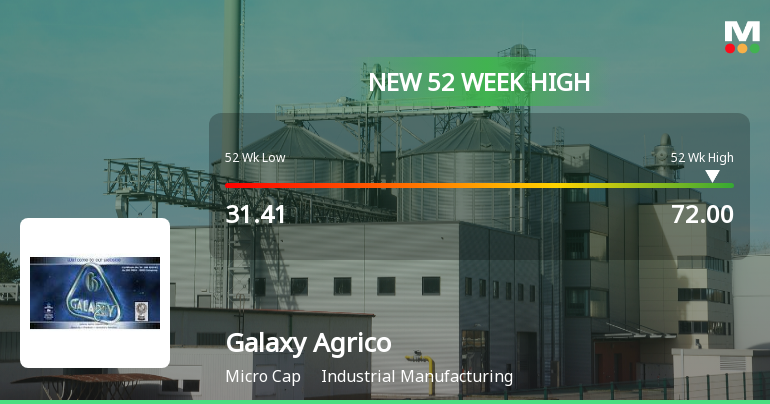
Broad-Based Technical Strength Lifts Galaxy Agrico Exports Ltd to 52-Week High of Rs 72
With a decisive surge to Rs 72 on 10 Jun 2026, Galaxy Agrico Exports Ltd has reached a fresh 52-week high, marking an impressive 80.54% gain over the past year. This rally stands in stark contrast to the Sensex’s 9.82% decline during the same period, underscoring the stock’s strong momentum amid a mixed market backdrop.
Read full news article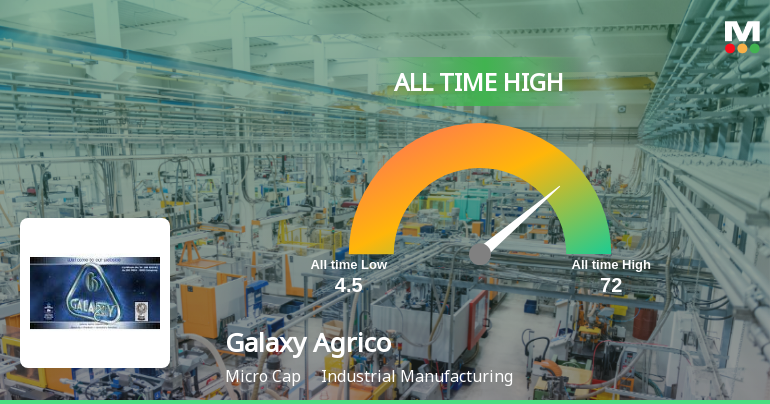
Galaxy Agrico Exports Ltd Hits All-Time High of Rs 72 as Momentum Builds Across Timeframes
After opening with an 8.43% gap up, Galaxy Agrico Exports Ltd surged to touch a fresh all-time high of Rs 72 on 10 Jun 2026, extending its recent winning streak and significantly outperforming the broader market indices.
Read full news article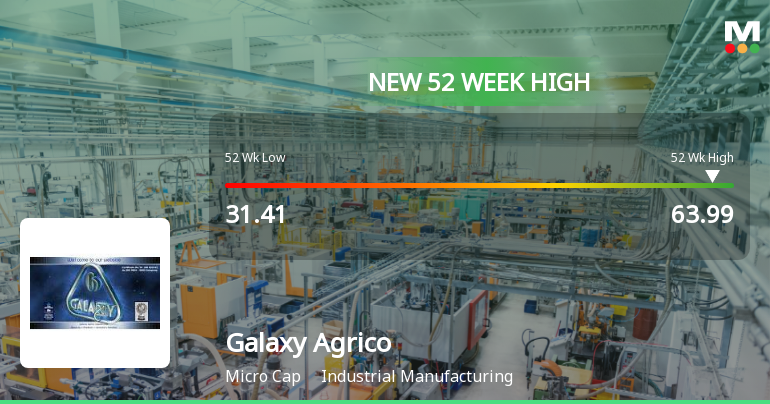
Broad-Based Technical Strength Lifts Galaxy Agrico Exports Ltd to 52-Week High of Rs 63.99
With a decisive intraday peak at Rs 63.99 on 4 Jun 2026, Galaxy Agrico Exports Ltd has surged to a fresh 52-week high, marking a 36.07% gain over the past year. This rally stands in stark contrast to the broader Sensex, which has declined by 8.48% over the same period, underscoring the stock's strong price momentum amid a challenging market backdrop.
Read full news article Announcements
Announcement under Regulation 30 (LODR)-Newspaper Publication
04-Jun-2026 | Source : BSEAnnouncement under Regulation 30 (LODR) - Newspaper Publication of Financial results for the quarter and year ended 31st March 2026
Intimation Under Regulation 31A(8)(C) Of SEBI (Listing Obligations And Disclosure Requirements) Regulations 2015 Regarding Submission Of Application For Reclassification Of Promoter(S) / Promoter Group Category To Public Category
04-Jun-2026 | Source : BSEIntimation Under Regulation 31A(8)(c) of SEBI (Listing Obligations and Disclosure Requirements) Regulations 2015 regarding submission of application for reclassication of Promoter(s)/ promoter Group category to Public category
Announcement under Regulation 30 (LODR)-Appointment of Statutory Auditor/s
30-May-2026 | Source : BSEAppointment of Statutory Auditor of the Company
Corporate Actions

No Upcoming Board Meetings

No Dividend history available

No Splits history available

No Bonus history available

Galaxy Agrico Exports Ltd has announced 5:1 rights issue, ex-date: 23 Jan 26
Quality key factors
Valuation key factors
Technicals key factors
 Technical Indicator Scale: Bearish, Mildly Bearish, Sideways, Mildly Bullish, Bullish Turned
 Shareholding Snapshot : Mar 2026
Shareholding Compare (%holding)
Non Institution
None
Held by 0 Schemes
Held by 0 FIIs
Nayanaben Ashwinkumar Shah (1.24%)
Impex Services Ltd (7.11%)
58.73%
Quarterly Results Snapshot (Standalone) - Mar'26 - QoQ

QoQ Growth in quarter ended Mar 2026 is -100.00% vs -23.47% in Dec 2025
QoQ Growth in quarter ended Mar 2026 is -122.03% vs 2,513.64% in Dec 2025
Half Yearly Results Snapshot (Standalone) - Sep'25

Growth in half year ended Sep 2025 is -5.08% vs -23.94% in Sep 2024
Growth in half year ended Sep 2025 is -335.71% vs 126.92% in Sep 2024
Nine Monthly Results Snapshot (Standalone) - Dec'25
YoY Growth in nine months ended Dec 2025 is -3.32% vs -58.37% in Dec 2024
YoY Growth in nine months ended Dec 2025 is 8,200.00% vs 114.29% in Dec 2024
Annual Results Snapshot (Standalone) - Mar'26
YoY Growth in year ended Mar 2026 is -27.02% vs -50.96% in Mar 2025
YoY Growth in year ended Mar 2026 is 4,662.50% vs 114.29% in Mar 2025
About Galaxy Agrico Exports Ltd

Company Coordinates


