
Compare Galaxy Surfact. with Similar Stocks
Stock DNA
Specialty Chemicals
INR 6,733 Cr (Small Cap)
23.00
42
0.21%
-0.15
11.30%
2.61
Total Returns (Price + Dividend) 
Latest dividend: 4 per share ex-dividend date: Aug-01-2025
Risk Adjusted Returns v/s
Returns Beta

News
Galaxy Surfactants Ltd is Rated Sell
Galaxy Surfactants Ltd is rated 'Sell' by MarketsMOJO. This rating was last updated on 01 January 2026, reflecting a change from a previous 'Strong Sell' grade. However, the analysis and financial metrics discussed here represent the stock's current position as of 30 April 2026, providing investors with an up-to-date view of the company’s performance and outlook.
Read full news article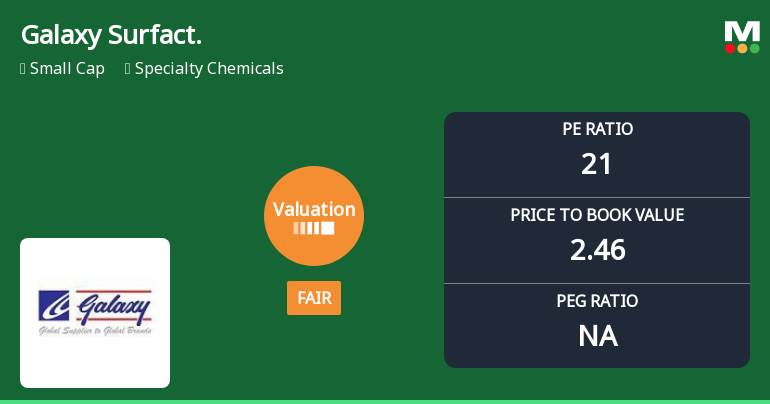
Galaxy Surfactants Ltd Valuation Shifts Signal Improved Price Attractiveness Amid Sector Challenges
Galaxy Surfactants Ltd has witnessed a notable shift in its valuation parameters, moving from an expensive to a fair valuation band, as reflected in its current price-to-earnings (P/E) and price-to-book value (P/BV) ratios. Despite this improvement, the stock continues to face headwinds amid broader sector challenges and a cautious market outlook, with its recent downgrade in Mojo Grade underscoring investor concerns.
Read full news article
Galaxy Surfactants Ltd is Rated Sell
Galaxy Surfactants Ltd is rated 'Sell' by MarketsMOJO, with this rating last updated on 01 Jan 2026. However, the analysis and financial metrics discussed here reflect the stock's current position as of 19 April 2026, providing investors with an up-to-date view of the company’s performance and outlook.
Read full news article Announcements
Compliances-Certificate under Reg. 74 (5) of SEBI (DP) Regulations 2018
08-Apr-2026 | Source : BSECertificate under Reg 74(5) of SEBI (DP) Regulations 2018
Closure of Trading Window
31-Mar-2026 | Source : BSEPlease find attached intimation of closure of Trading Window
Announcement under Regulation 30 (LODR)-Change in Management
02-Mar-2026 | Source : BSEIntimation of appointment of Senior Management Personnel of the Company .
Corporate Actions

No Upcoming Board Meetings

Galaxy Surfactants Ltd has declared 40% dividend, ex-date: 01 Aug 25

No Splits history available

No Bonus history available

No Rights history available
Quality key factors
Valuation key factors
Technicals key factors
 Technical Indicator Scale: Bearish, Mildly Bearish, Sideways, Mildly Bullish, Bullish Turned
 Shareholding Snapshot : Mar 2026
Shareholding Compare (%holding)
Promoters
0.0227
Held by 6 Schemes (11.62%)
Held by 88 FIIs (3.99%)
Unnathan Shekhar (11.92%)
Axis Mutual Fund (4.38%)
8.62%
Quarterly Results Snapshot (Consolidated) - Dec'25 - YoY

YoY Growth in quarter ended Dec 2025 is 27.63% vs 10.76% in Dec 2024
YoY Growth in quarter ended Dec 2025 is -8.73% vs -9.47% in Dec 2024
Half Yearly Results Snapshot (Consolidated) - Sep'25
Growth in half year ended Sep 2025 is 27.84% vs 5.83% in Sep 2024

Growth in half year ended Sep 2025 is -11.22% vs 7.75% in Sep 2024
Nine Monthly Results Snapshot (Consolidated) - Dec'25
YoY Growth in nine months ended Dec 2025 is 27.77% vs 7.45% in Dec 2024
YoY Growth in nine months ended Dec 2025 is -10.52% vs 2.26% in Dec 2024
Annual Results Snapshot (Consolidated) - Mar'25
YoY Growth in year ended Mar 2025 is 11.31% vs -15.00% in Mar 2024
YoY Growth in year ended Mar 2025 is 1.14% vs -20.87% in Mar 2024
About Galaxy Surfactants Ltd

Company Coordinates


