
Compare Galaxy Surfact. with Similar Stocks
Stock DNA
Specialty Chemicals
INR 5,938 Cr (Small Cap)
21.00
42
0.23%
-0.19
10.09%
2.20
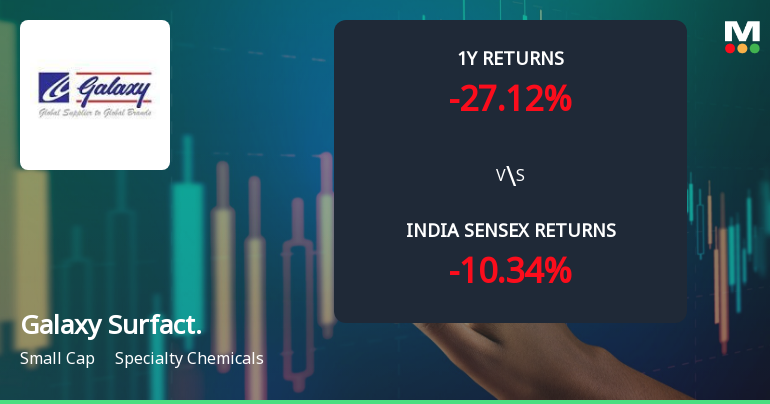
Total Returns (Price + Dividend) 
Latest dividend: 4 per share ex-dividend date: Aug-01-2025
Risk Adjusted Returns v/s
Returns Beta

News
Galaxy Surfactants Ltd Faces Bearish Momentum Amid Technical Indicator Shifts
Galaxy Surfactants Ltd, a small-cap player in the Specialty Chemicals sector, has experienced a notable shift in its technical momentum, moving from a mildly bearish stance to a more pronounced bearish trend. Despite a marginal day change of -0.10%, the stock’s technical indicators reveal a complex interplay of signals that suggest caution for investors amid broader market pressures and sectoral challenges.
Read full news article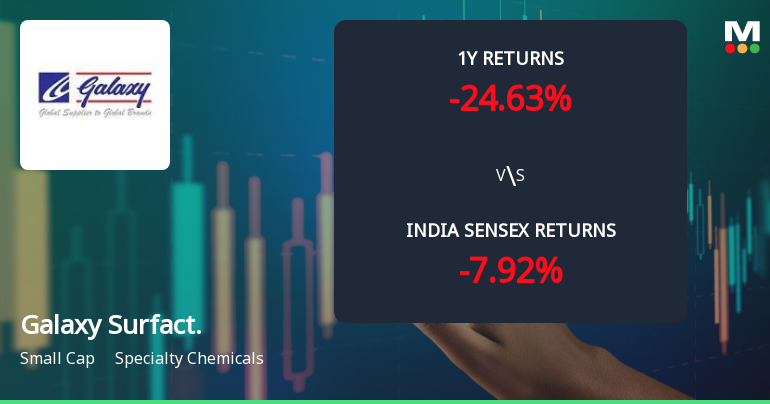
Galaxy Surfactants Ltd Technical Momentum Shifts Amid Bearish Sentiment
Galaxy Surfactants Ltd, a specialty chemicals company, is currently exhibiting a shift towards bearish momentum as multiple technical indicators signal caution. Despite some mildly bullish weekly signals, the overall technical landscape points to a deteriorating trend, with the company’s stock price underperforming key benchmarks such as the Sensex over various time frames.
Read full news article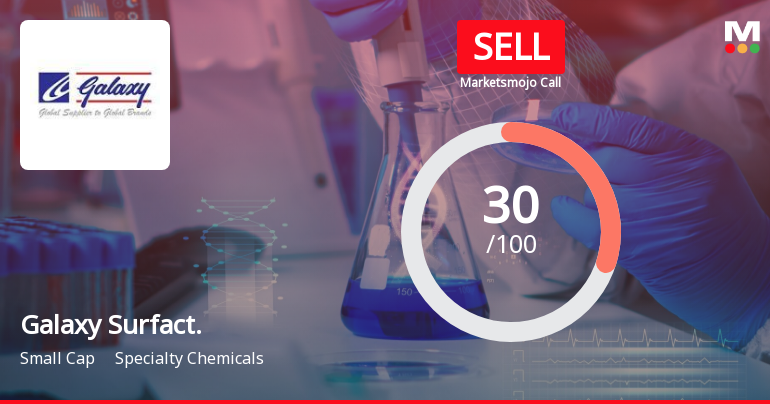
Galaxy Surfactants Ltd is Rated Sell
Galaxy Surfactants Ltd is rated 'Sell' by MarketsMOJO, with this rating last updated on 01 January 2026. However, the analysis and financial metrics discussed here reflect the stock's current position as of 02 June 2026, providing investors with an up-to-date view of the company’s performance and outlook.
Read full news article Announcements
Announcement under Regulation 30 (LODR)-Analyst / Investor Meet - Intimation
03-Jun-2026 | Source : BSEPlease find attached Intimation of Investor Meet
Announcement under Regulation 30 (LODR)-Earnings Call Transcript
21-May-2026 | Source : BSEPlease find attached Transcript of Q4 FY 2026 Earnings call.
Announcement under Regulation 30 (LODR)-Change in Management
15-May-2026 | Source : BSEPlease find attached disclosure regarding change in Senior Management.
Corporate Actions

No Upcoming Board Meetings

Galaxy Surfactants Ltd has declared 40% dividend, ex-date: 01 Aug 25

No Splits history available

No Bonus history available

No Rights history available
Quality key factors
Valuation key factors
Technicals key factors
 Technical Indicator Scale: Bearish, Mildly Bearish, Sideways, Mildly Bullish, Bullish Turned
 Shareholding Snapshot : Mar 2026
Shareholding Compare (%holding)
Promoters
0.0227
Held by 6 Schemes (11.62%)
Held by 88 FIIs (3.99%)
Unnathan Shekhar (11.92%)
Axis Mutual Fund (4.38%)
8.62%
Quarterly Results Snapshot (Consolidated) - Mar'26 - YoY

YoY Growth in quarter ended Mar 2026 is 14.83% vs 23.24% in Mar 2025
YoY Growth in quarter ended Mar 2026 is -17.71% vs -2.10% in Mar 2025
Half Yearly Results Snapshot (Consolidated) - Sep'25

Growth in half year ended Sep 2025 is 27.84% vs 5.83% in Sep 2024
Growth in half year ended Sep 2025 is -11.22% vs 7.75% in Sep 2024
Nine Monthly Results Snapshot (Consolidated) - Dec'25
YoY Growth in nine months ended Dec 2025 is 27.77% vs 7.45% in Dec 2024
YoY Growth in nine months ended Dec 2025 is -10.52% vs 2.26% in Dec 2024
Annual Results Snapshot (Consolidated) - Mar'26
YoY Growth in year ended Mar 2026 is 24.26% vs 11.31% in Mar 2025
YoY Growth in year ended Mar 2026 is -12.31% vs 1.14% in Mar 2025
About Galaxy Surfactants Ltd

Company Coordinates


