Gandhar Oil Ref.

INR
256.00
0.75 (0.29%)
BSENSE

Aug 27, 02:28 PM

BSE+NSE Vol: 5.54 lacs

  • Price Points
  • Score
  • Mojo Parameters
  • Total Return
  • News and Corporate Actions
  • Key factors
  • Shareholding
  • Financials
  • CompanyCV
stock-summaryPrice Point
High/Low

1Day

52 Week

Valuation
Technical
Day's Volume

CASH

5.54 lacs (-22.78%) Volume

Shareholding (Jun 2026)

FII

1.28%

Held by 14 FIIs

DII

1.02%

Held by 0 DIIs

Promoter

66.60%

Why is Gandhar Oil Refinery (India) Ltd falling/rising?

27-Aug-2026

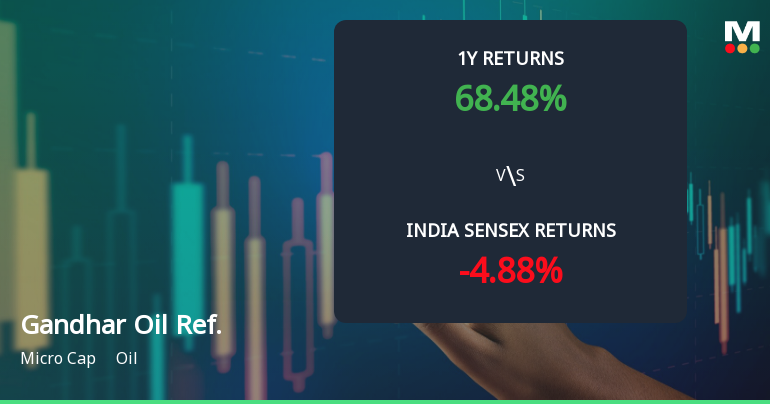
As of 26-Aug, the stock price of Gandhar Oil Refinery (India) Ltd is at 255.25, unchanged from the previous day, with a recent decline of 0.57% over two days. Despite this, the stock has grown 65.37% year-to-date, outperforming the Sensex, but has seen a negative trend in the last month and a drop in investor participation.

As of 26-Aug, the stock price of Gandhar Oil Refinery (India) Ltd is currently at 255.25, showing no change from the previous day. The stock has been experiencing a decline, having fallen for the last two days with a total return of -0.57% during this period. Despite this recent downturn, the stock has outperformed the sector today by 0.9%. <BR><BR>Looking at the broader performance metrics, the stock has shown significant growth year-to-date, with a remarkable increase of 65.37%, while the benchmark Sensex has decreased by 9.09% in the same timeframe. Over the past year, the stock has risen by 71.42%, contrasting with a decline of 4.10% in the Sensex. However, the stock's performance over the last month has been negative, with a decrease of 9.87%, while the Sensex gained 1.86%.<BR><BR>Additionally, the stock is currently trading above its 5-day, 20-day, 50-day, 100-day, and 200-day moving averages, indicating a generally positive trend in the longer term. Nonetheless, there is a notable decline in investor participation, as evidenced by a 43.85% drop in delivery volume compared to the 5-day average. This decrease in trading activity may contribute to the stock's recent price stagnation and slight decline.<BR><BR>In summary, while Gandhar Oil Refinery (India) Ltd has shown strong performance over the longer term, recent short-term declines, reduced investor participation, and a slight drop in returns over the last two days are contributing factors to its current price behavior.

View full answer

Should I buy, sell or hold Gandhar Oil Refinery (India) Ltd?

26-Aug-2026

Who are in the management team of Gandhar Oil Ref.?

14-Aug-2026

The management team of Gandhar Oil Ref. includes Ramesh Babulal Parekh (Chairman & Managing Director), Samir Ramesh Parekh (Vice Chairman & Joint Managing Director), Aslesh Rameshkumar Parekh (Joint Managing Director), and several independent directors, along with the Company Secretary, Jayshree Soni. They are responsible for the company's strategic direction and governance.

The management team of Gandhar Oil Ref. includes the following key members:<BR><BR>1. **Ramesh Babulal Parekh** - Chairman & Managing Director<BR>2. **Samir Ramesh Parekh** - Vice Chairman & Joint Managing Director<BR>3. **Aslesh Rameshkumar Parekh** - Joint Managing Director<BR>4. **Raj Kishore Singh** - Independent Director<BR>5. **Amrita Nautiyal** - Independent Director<BR>6. **Deena A Mehta** - Independent Director<BR>7. **Jayshree Soni** - Company Secretary & Compliance Officer<BR><BR>This team plays a crucial role in the strategic direction and governance of the company.

View full answer

What does Gandhar Oil Ref. do?

14-Aug-2026

Gandhar Oil Refinery (India) Ltd is a micro-cap company in the oil industry, reporting net sales of ₹1,732 Cr and a net profit of ₹192 Cr for June 2026. Key metrics include a P/E ratio of 8.00, a dividend yield of 1.15%, and a market cap of ₹2,410 Cr.

Overview:<BR>Gandhar Oil Refinery (India) Ltd operates in the oil industry and is categorized as a micro-cap company.<BR><BR>History:<BR>The company was incorporated in 1992 as Gandhar Oil Refinery (India) Private Limited. It changed its name to Sunoco Industries Private Limited in 2004 and later became a public company, retaining the name Gandhar Oil Refinery (India) Limited in 2005. The latest quarterly results reported net sales and profit for June 2026.<BR><BR>Financial Snapshot:<BR>- Net Sales: 1,732 Cr (Quarterly Results - Jun 2026)<BR>- Net Profit: 192 Cr (Quarterly Results - Jun 2026)<BR>- Market-cap: INR 2,410 Cr (Micro Cap)<BR><BR>Key Metrics:<BR>- P/E: 8.00<BR>- Industry P/E: 14<BR>- Dividend Yield: 1.15%<BR>- Debt Equity: 0.14<BR>- Return on Equity: 10.01%<BR>- Price to Book: 1.72<BR><BR>Contact Details:<BR>Registrar Address: Not available.

View full answer

Who are the peers of the Gandhar Oil Ref.?

14-Aug-2026

Gandhar Oil Ref.'s peers include Savita Oil Tech, Deep Industries, Panama Petrochem, Antelopus Selan, Veedol Corporat, Prabha Energy, Hind.Oil Explor., Dolphin Offshore, and Asian Energy. Notably, Savita Oil Tech leads in 1-year returns at 65.90%, while Gandhar Oil Ref. has a strong return of 61.85%.

Peers: The peers of Gandhar Oil Ref. are Savita Oil Tech, Deep Industries, Panama Petrochem, Antelopus Selan, Veedol Corporat, Prabha Energy, Hind.Oil Explor., Dolphin Offshore, and Asian Energy.<BR><BR>Quality Snapshot: Excellent management risk is observed at Savita Oil Tech and Deep Industries, while Average management risk is found at Panama Petrochem, Antelopus Selan, Veedol Corporat, Gandhar Oil Ref., Hind.Oil Explor., Asian Energy, and the rest. Below Average management risk is noted at Deep Industries, Prabha Energy, and Dolphin Offshore. Growth is Excellent for Deep Industries, Antelopus Selan, and Dolphin Offshore, while Average growth is seen at Gandhar Oil Ref., Prabha Energy, and the rest. Below Average growth is reported for Savita Oil Tech, Panama Petrochem, Veedol Corporat, Hind.Oil Explor., and Asian Energy. Excellent capital structure is noted at Savita Oil Tech, Deep Industries, Panama Petrochem, Antelopus Selan, Veedol Corporat, and Asian Energy, while Gandhar Oil Ref. and Hind.Oil Explor. have Good capital structure, and Prabha Energy has Below Average capital structure.<BR><BR>Return Snapshot: The peer with the highest 1-year return is Savita Oil Tech at 65.90%, while Prabha Energy has the lowest at -39.34%. Gandhar Oil Ref.'s 1-year return of 61.85% is significantly higher than Prabha Energy's. Additionally, Prabha Energy and Hind.Oil Explor. are the only peers with negative six-month returns.

View full answer

How big is Gandhar Oil Ref.?

14-Aug-2026

As of 14th August, Gandhar Oil Refinery (India) Ltd has a market capitalization of 2,395.11 Cr, with recent net sales of 5,052.27 Cr and a net profit of 301.41 Cr.

As of 14th August, Gandhar Oil Refinery (India) Ltd has a market capitalization of 2,395.11 Cr, categorizing it as a Micro Cap company.<BR><BR>In the latest four quarters, Gandhar Oil Refinery reported Net Sales of 5,052.27 Cr and a Net Profit of 301.41 Cr.<BR><BR>The latest annual period for the balance sheet is March 2025, with Shareholder's Funds amounting to 1,236.10 Cr and Total Assets valued at 1,959.09 Cr.

View full answer

Has Gandhar Oil Refinery (India) Ltd declared dividend?

24-Jul-2026

Yes, Gandhar Oil Refinery (India) Ltd has declared a 100% dividend, amounting to approximately ₹0.739 per share, with an ex-date of January 30, 2026. The company has shown strong total returns, particularly in the 3-month (107.82%) and 6-month (74.58%) periods.

Gandhar Oil Refinery (India) Ltd has declared a 100% dividend.<BR><BR>Dividend Details:<BR>- Percentage announced: 100%<BR>- Amount per share: 0.7390133333333334<BR>- Ex-date: Jan-30-2026<BR><BR>Dividend Yield: 0.44%<BR><BR>Total Returns by Period:<BR>In the 3-month period, the price return was 106.41%, the dividend return was 1.41%, resulting in a total return of 107.82%.<BR><BR>In the 6-month period, the price return was 72.79%, the dividend return was 1.79%, leading to a total return of 74.58%.<BR><BR>For the 1-year period, the price return was 68.72%, the dividend return was 1.96%, culminating in a total return of 70.68%.<BR><BR>Over the 2-year period, the price return was 36.48%, the dividend return was 1.85%, which resulted in a total return of 38.33%.<BR><BR>In the 3-year period, there was no price return and no dividend return, resulting in a total return of 0.0%.<BR><BR>Similarly, in the 4-year period, there was no price return and no dividend return, leading to a total return of 0.0%.<BR><BR>Lastly, in the 5-year period, there was no price return and no dividend return, resulting in a total return of 0.0%.<BR><BR>Overall, Gandhar Oil Refinery has declared a significant dividend, and the total returns indicate strong performance in the short to medium term, particularly over the 3-month and 6-month periods.

View full answer

Are Gandhar Oil Refinery (India) Ltd latest results good or bad?

23-Jul-2026

Gandhar Oil Refinery (India) Ltd's latest results are very good, with a net profit of ₹192.29 crores, a 633.09% increase year-over-year, and net sales rising to ₹1,731.93 crores, up 91.81% year-over-year. The company also achieved its highest operating margin at 16.24%, indicating strong operational performance.

Gandhar Oil Refinery (India) Ltd's latest results are quite impressive, indicating a strong performance overall. In the quarter ending June 2026, the company reported a consolidated net profit of ₹192.29 crores, which is a staggering increase of 633.09% year-over-year and 372.69% quarter-over-quarter. Additionally, net sales surged to ₹1,731.93 crores, reflecting a remarkable growth of 91.81% year-over-year and 58.40% from the previous quarter.<BR><BR>One of the standout features of this quarter was the operating margin, which expanded to 16.24%, the highest ever recorded for the company. This improvement in margins is attributed to robust revenue growth and enhanced operational efficiency. The profit after tax margin also saw a significant rise to 11.89%, up from just 2.89% a year ago.<BR><BR>Overall, the financial metrics suggest that Gandhar Oil Refinery has experienced a remarkable turnaround, showcasing strong operational leverage and profitability. This performance positions the company favorably compared to the broader oil sector, which has faced challenges recently. Therefore, the latest results can be classified as very good, reflecting a strong upward trajectory for the company.

View full answer

When is the next results date for Gandhar Oil Refinery (India) Ltd?

16-Jul-2026

The next results date for Gandhar Oil Refinery (India) Ltd is July 22, 2026.

The next results date for Gandhar Oil Refinery (India) Ltd is scheduled for July 22, 2026.

View full answer

Is Gandhar Oil Ref. overvalued or undervalued?

26-Nov-2025

As of November 25, 2025, Gandhar Oil Ref. is considered very attractive and undervalued, with a PE Ratio of 13.82, an EV to EBITDA of 8.01, and a Price to Book Value of 1.00, indicating potential for growth despite a year-to-date stock performance lagging behind the Sensex.

As of 25 November 2025, the valuation grade for Gandhar Oil Ref. has moved from attractive to very attractive. The company is currently considered undervalued. Key ratios include a PE Ratio of 13.82, an EV to EBITDA of 8.01, and a Price to Book Value of 1.00, which suggest that the company is trading at a discount relative to its earnings and assets.<BR><BR>In comparison to its peers, Gandhar Oil Ref. has a lower PE Ratio than Reliance Industries, which stands at 25.06, and is also more favorably positioned than ONGC, which has a PE Ratio of 8.42. The PEG Ratio for Gandhar is notably at 0.00, indicating potential for growth without the corresponding price increase. Despite recent stock performance lagging behind the Sensex, with a year-to-date return of -38.15% compared to the Sensex's 8.25%, the underlying valuation metrics suggest that the stock may present a buying opportunity for investors.

View full answer

Is Gandhar Oil Ref. technically bullish or bearish?

20-Nov-2025

As of November 19, 2025, the technical trend has shifted to a bearish stance, supported by daily moving averages, weekly Bollinger Bands, and KST indicators, despite a mildly bullish MACD, with the stock underperforming against the Sensex.

As of 19 November 2025, the technical trend has changed from mildly bearish to bearish. The current stance is bearish with moderate strength. Key indicators include the daily moving averages showing bearish signals, the weekly Bollinger Bands indicating bearish conditions, and the KST on a weekly basis also reflecting a bearish trend. The MACD is mildly bullish on the weekly timeframe, but this is overshadowed by the overall bearish sentiment from other indicators. The stock has underperformed significantly compared to the Sensex over various time frames, further supporting the bearish outlook.

View full answer

How has been the historical performance of Gandhar Oil Ref.?

13-Nov-2025

Gandhar Oil Ref. has shown fluctuating financial performance, with net sales decreasing from 4,113.21 crore in March 2024 to 3,896.92 crore in March 2025, alongside declines in profitability and cash flow, despite an increase in total assets.

Answer:<BR>The historical performance of Gandhar Oil Ref. shows a fluctuating trend in its financial metrics over the past few years.<BR><BR>Breakdown:<BR>Gandhar Oil Ref. reported net sales of 3,896.92 crore in March 2025, a decrease from 4,113.21 crore in March 2024 and 4,079.03 crore in March 2023, but an increase from 3,543.37 crore in March 2022. The total operating income mirrored this trend, remaining at 3,896.92 crore in March 2025. The raw material costs were 3,423.42 crore in March 2025, down from 3,532.99 crore in March 2024, while the total expenditure (excluding depreciation) was 3,721.28 crore, a slight decrease from 3,834.49 crore in the previous year. Operating profit (PBDIT) fell to 188.64 crore in March 2025 from 288.61 crore in March 2024, with profit before tax also declining to 114.34 crore from 210.30 crore. Consequently, profit after tax decreased to 83.61 crore in March 2025 from 165.32 crore in March 2024. The consolidated net profit was 80.03 crore in March 2025, down from 140.52 crore in March 2024. The company's total assets increased to 1,959.09 crore in March 2025 from 1,939.99 crore in March 2024, while total liabilities also rose to 1,959.09 crore. Cash flow from operating activities showed a negative trend, with a cash outflow of 69.00 crore in March 2024 compared to a positive inflow of 87.00 crore in March 2023. Overall, Gandhar Oil Ref. has experienced a decline in profitability and cash flow, despite an increase in total assets.

View full answer

Who are the top shareholders of the Gandhar Oil Ref.?

17-Jul-2025

The top shareholders of Gandhar Oil Ref. include Ramesh Babulal Parekh with 28.62%, Bandhan AMC Limited at 2.25%, and individual investors holding 25.62%. Additionally, a mutual fund holds 1.62%, while nine foreign institutional investors collectively hold 0.18%.

The top shareholders of Gandhar Oil Ref. include the promoters, with Ramesh Babulal Parekh holding the highest stake at 28.62%. In terms of public shareholders, Bandhan AMC Limited is the largest, holding 2.25%. Additionally, individual investors collectively hold 25.62% of the company. There are also mutual funds involved, with one scheme holding 1.62%, and nine foreign institutional investors (FIIs) holding a total of 0.18%.

View full answer
iScoreScore
Click here to find our call on this stock
Strong Sell
Sell
Hold
Buy
Strong Buy

Dashboard

1

Company has a Debt to Equity ratio (avg) of 0.09 times

 
2

With a growth in Net Profit of 455.71%, the company declared Outstanding results in Jun 26

3

With ROCE of 13.3, it has a Attractive valuation with a 1.7 Enterprise value to Capital Employed

4

Increasing Participation by Institutional Investors

5

Market Beating Performance

stock-summaryMojo Parameters

Mojo Parameters

Loading Valuation Snapshot...

Stock DNA

stock-summary
Industry

Oil

stock-summary
Market cap

INR 2,506 Cr (Micro Cap)

stock-summary
P/E

8.00

stock-summary
Industry P/E

14

stock-summary
Dividend Yield

1.07%

stock-summary
Debt Equity

0.14

stock-summary
Return on Equity

10.01%

stock-summary
Price to Book

1.85

Revenue and Profits:
Net Sales:
1,732 Cr
(Quarterly Results - Jun 2026)
Net Profit:
192 Cr
stock-summaryTotal Returns
Total Returns (Price + Dividend) stock-summary
Dividend Yield (1.07%)
TimePeriod
Price Return
Dividend Return
Total Return
3 Months
57.1%
1.28%
58.38%
6 Months
82.27%
1.46%
83.73%
1 Year
71.93%
1.89%
73.82%
2 Years
19.46%
1.49%
20.95%
3 Years
0%
0%
0.0%
4 Years
0%
0%
0.0%
5 Years
0%
0%
0.0%

Latest dividend: 2 per share ex-dividend date: Jul-31-2026

Risk Adjusted Returns v/s stock-summary
Returns Beta
Icon
Beta has not been calculated since enough price history is not available
stock-summaryNews & Corporate Actions

News

Announcements stock-summary

Announcement under Regulation 30 (LODR)-Newspaper Publication

20-Aug-2026 | Source : BSE

Pursuant to Regulation 30 read with Regulation 47 of the SEBI (Listing Obligations and Disclosure Requirements) Regulations 2015 and in compliance with section 108 of the Comapnies Act 2013 read with Rule 20 of the Comapnies (Management and Administration) Rules 2014 Regulation 44 of the SEBI Listing Regulations and the Secretarial Standards on General Meetings issued by the Institute of Company Secretaries of India please find enclosed copies of the newspaper advertisements published on August 20th 2026 in Business Standard (English) and the Sakal Samachar (Marathi Edition) informing the Members of the Company regarding the dispatch of the Notice and e-voting information for the 34th Annual General Meeting of the Comapny scheduled to be held on Friday September 11th 2026 at 11:00 A.M. (IST) through Video Conferencing ("VC")/Other Audio-Visual Means ("OAVM").

Reg. 34 (1) Annual Report.

19-Aug-2026 | Source : BSE

Please find attached herewith Annual report for Financial year 2025-26 along with Notice of 34th AGM of the Company scheduled to be held on Friday September 11 2026 at 11:00 A.M. (IST) through video-conferencing/ Other Audio-visual means

Business Responsibility and Sustainability Reporting (BRSR)

19-Aug-2026 | Source : BSE

Pursuant to Regulation 34(2)(f) of the Securities and Exchange Board of India (Listing Obligations and Disclosure Requirements) Regulations 2015 as amended please find enclosed herewith the Business Responsibilty and Sustainability Report ("BRSR") of the Company for the Financial Year 2025-26 which also forms an internal part of Annual Report of the Company for Financial Year 2025-26.

Corporate Actions stock-summary

stock-summary
BOARD MEETING

No Upcoming Board Meetings

stock-summary
DIVIDEND

Gandhar Oil Refinery (India) Ltd has declared 100% dividend, ex-date: 31 Jul 26

stock-summary
SPLITS

No Splits history available

stock-summary
BONUS

No Bonus history available

stock-summary
RIGHTS

No Rights history available

stock-summaryKey Factors

Quality key factors stock-summary

Factor
Value
Sales Growth (5y)
7.75%
EBIT Growth (5y)
16.48%
EBIT to Interest (avg)
5.68
Debt to EBITDA (avg)
1.33
Net Debt to Equity (avg)
0.14
Sales to Capital Employed (avg)
2.80
Tax Ratio
23.15%
Dividend Payout Ratio
5.42%
Pledged Shares
0
Institutional Holding
2.30%
ROCE (avg)
17.13%
ROE (avg)
9.49%

Valuation key factors

Factor
Value
P/E Ratio
8
Industry P/E
14
Price to Book Value
1.85
EV to EBIT
6.10
EV to EBITDA
5.70
EV to Capital Employed
1.74
EV to Sales
0.53
PEG Ratio
0.03
Dividend Yield
1.07%
ROCE (Latest)
13.32%
ROE (Latest)
10.01%

Technicals key factors

Indicator
Weekly
Monthly
MACD
Bullish
Mildly Bearish
RSI
No Signal
Bearish
Bollinger Bands
Bullish
Bullish
Moving Averages
Bullish (Daily)
KST
Bearish
Dow Theory
Mildly Bullish
No Trend
OBV
Mildly Bullish
No Trend
stock-summary Technical Indicator Scale: Bearish, Mildly Bearish, Sideways, Mildly Bullish, Bullish  Turned 
stock-summaryShareholding
Shareholding Snapshot : Jun 2026stock-summary
Shareholding Compare (%holding) stock-summary
Majority shareholders

Promoters

Pledged Promoter Holdings

None

Mutual Funds

Held by 0 Schemes

FIIs

Held by 14 FIIs (1.28%)

Promoter with highest holding

Ramesh Babulal Parekh (28.75%)

Highest Public shareholder

None

Individual Investors Holdings

25.93%

stock-summaryFinancial
[
  {
    "link": "quarterly",
    "btn_text": "All Quarterly Results",
    "header": "Quarterly Results Snapshot (Consolidated) - Jun'26 - QoQ",
    "rhs": [
      {
        "prefix": "Net Sales ",
        "suffix": "QoQ Growth in quarter ended Jun 2026 is 58.40% vs -6.31% in Mar 2026",
        "dir": 1
      },
      {
        "prefix": "Consolidated Net Profit ",
        "suffix": "QoQ Growth in quarter ended Jun 2026 is 372.69% vs 25.59% in Mar 2026",
        "dir": 1
      }
    ],
    "table": {
      "header": [
        "Jun'26",
        "Mar'26",
        "Change(%)"
      ],
      "body": [
        {
          "field": "Net Sales",
          "val1": "1,731.93",
          "val2": "1,093.37",
          "chgp": "58.40%",
          "chgp_class": "positive"
        },
        {
          "field": "Operating Profit (PBDIT) excl Other Income",
          "val1": "281.32",
          "val2": "63.55",
          "chgp": "342.68%",
          "chgp_class": "positive"
        },
        {
          "field": "Interest",
          "val1": "12.74",
          "val2": "7.61",
          "chgp": "67.41%",
          "chgp_class": "negative"
        },
        {
          "field": "Exceptional Items",
          "val1": "0.00",
          "val2": "0.00",
          "chgp": "",
          "chgp_class": "neutral"
        },
        {
          "field": "Consolidate Net Profit",
          "val1": "192.29",
          "val2": "40.68",
          "chgp": "372.69%",
          "chgp_class": "positive"
        },
        {
          "field": "Operating Profit Margin (Excl OI)",
          "val1": "16.24%",
          "val2": "5.81%",
          "chgp": "10.43%",
          "chgp_class": "positive"
        }
      ]
    }
  },
  {
    "link": "half-yearly",
    "btn_text": "All Half Yearly Results",
    "header": "Half Yearly Results Snapshot (Consolidated) - Sep'25",
    "rhs": [
      {
        "prefix": "Net Sales ",
        "suffix": " Growth in half year ended Sep 2025 is 1.71% vs -6.83% in Sep 2024",
        "dir": 1
      },
      {
        "prefix": "Consolidated Net Profit ",
        "suffix": " Growth in half year ended Sep 2025 is 27.02% vs -41.67% in Sep 2024",
        "dir": 1
      }
    ],
    "table": {
      "header": [
        "Sep'25",
        "Sep'24",
        "Change(%)"
      ],
      "body": [
        {
          "field": "Net Sales",
          "val1": "1,962.87",
          "val2": "1,929.91",
          "chgp": "1.71%",
          "chgp_class": "positive"
        },
        {
          "field": "Operating Profit (PBDIT) excl Other Income",
          "val1": "111.80",
          "val2": "100.50",
          "chgp": "11.24%",
          "chgp_class": "positive"
        },
        {
          "field": "Interest",
          "val1": "19.89",
          "val2": "24.39",
          "chgp": "-18.45%",
          "chgp_class": "positive"
        },
        {
          "field": "Exceptional Items",
          "val1": "0.00",
          "val2": "0.00",
          "chgp": "",
          "chgp_class": "neutral"
        },
        {
          "field": "Consolidate Net Profit",
          "val1": "62.28",
          "val2": "49.03",
          "chgp": "27.02%",
          "chgp_class": "positive"
        },
        {
          "field": "Operating Profit Margin (Excl OI)",
          "val1": "5.70%",
          "val2": "5.21%",
          "chgp": "0.49%",
          "chgp_class": "positive"
        }
      ]
    }
  },
  {
    "link": "nine-monthly",
    "btn_text": "All Nine Monthly Results",
    "header": "Nine Monthly Results Snapshot (Consolidated) - Dec'25",
    "rhs": [
      {
        "prefix": "Net Sales ",
        "suffix": "YoY Growth in nine months ended Dec 2025 is 6.63% vs -7.52% in Dec 2024",
        "dir": 1
      },
      {
        "prefix": "Consolidated Net Profit ",
        "suffix": "YoY Growth in nine months ended Dec 2025 is 38.49% vs -47.97% in Dec 2024",
        "dir": 1
      }
    ],
    "table": {
      "header": [
        "Dec'25",
        "Dec'24",
        "Change(%)"
      ],
      "body": [
        {
          "field": "Net Sales",
          "val1": "3,129.93",
          "val2": "2,935.20",
          "chgp": "6.63%",
          "chgp_class": "positive"
        },
        {
          "field": "Operating Profit (PBDIT) excl Other Income",
          "val1": "170.92",
          "val2": "142.07",
          "chgp": "20.31%",
          "chgp_class": "positive"
        },
        {
          "field": "Interest",
          "val1": "29.99",
          "val2": "34.89",
          "chgp": "-14.04%",
          "chgp_class": "positive"
        },
        {
          "field": "Exceptional Items",
          "val1": "0.00",
          "val2": "0.00",
          "chgp": "",
          "chgp_class": "neutral"
        },
        {
          "field": "Consolidate Net Profit",
          "val1": "94.67",
          "val2": "68.36",
          "chgp": "38.49%",
          "chgp_class": "positive"
        },
        {
          "field": "Operating Profit Margin (Excl OI)",
          "val1": "5.46%",
          "val2": "4.84%",
          "chgp": "0.62%",
          "chgp_class": "positive"
        }
      ]
    }
  },
  {
    "link": "annual",
    "btn_text": "All Annual Results",
    "header": "Annual Results Snapshot (Consolidated) - Mar'26",
    "rhs": [
      {
        "prefix": "Net Sales ",
        "suffix": "YoY Growth in year ended Mar 2026 is 8.83% vs -5.26% in Mar 2025",
        "dir": 1
      },
      {
        "prefix": "Consolidated Net Profit ",
        "suffix": "YoY Growth in year ended Mar 2026 is 69.09% vs -43.03% in Mar 2025",
        "dir": 1
      }
    ],
    "table": {
      "header": [
        "Mar'26",
        "Mar'25",
        "Change(%)"
      ],
      "body": [
        {
          "field": "Net Sales",
          "val1": "4,241.18",
          "val2": "3,896.93",
          "chgp": "8.83%",
          "chgp_class": "positive"
        },
        {
          "field": "Operating Profit (PBDIT) excl Other Income",
          "val1": "234.47",
          "val2": "175.66",
          "chgp": "33.48%",
          "chgp_class": "positive"
        },
        {
          "field": "Interest",
          "val1": "37.59",
          "val2": "48.40",
          "chgp": "-22.33%",
          "chgp_class": "positive"
        },
        {
          "field": "Exceptional Items",
          "val1": "0.00",
          "val2": "0.00",
          "chgp": "",
          "chgp_class": "neutral"
        },
        {
          "field": "Consolidate Net Profit",
          "val1": "135.37",
          "val2": "80.06",
          "chgp": "69.09%",
          "chgp_class": "positive"
        },
        {
          "field": "Operating Profit Margin (Excl OI)",
          "val1": "5.53%",
          "val2": "4.51%",
          "chgp": "1.02%",
          "chgp_class": "positive"
        }
      ]
    }
  }
]

Quarterly Results Snapshot (Consolidated) - Jun'26 - QoQstock-summary

Jun'26
Mar'26
Change(%)
Net Sales
1,731.93
1,093.37
58.40%
Operating Profit (PBDIT) excl Other Income
281.32
63.55
342.68%
Interest
12.74
7.61
67.41%
Exceptional Items
0.00
0.00
Consolidate Net Profit
192.29
40.68
372.69%
Operating Profit Margin (Excl OI)
16.24%
5.81%
10.43%
Values in Rs Cr.
Direction Arrows
Net Sales

QoQ Growth in quarter ended Jun 2026 is 58.40% vs -6.31% in Mar 2026

Direction Arrows
Consolidated Net Profit

QoQ Growth in quarter ended Jun 2026 is 372.69% vs 25.59% in Mar 2026

Half Yearly Results Snapshot (Consolidated) - Sep'25stock-summary

Sep'25
Sep'24
Change(%)
Net Sales
1,962.87
1,929.91
1.71%
Operating Profit (PBDIT) excl Other Income
111.80
100.50
11.24%
Interest
19.89
24.39
-18.45%
Exceptional Items
0.00
0.00
Consolidate Net Profit
62.28
49.03
27.02%
Operating Profit Margin (Excl OI)
5.70%
5.21%
0.49%
Values in Rs Cr.
Direction Arrows
Net Sales

Growth in half year ended Sep 2025 is 1.71% vs -6.83% in Sep 2024

Direction Arrows
Consolidated Net Profit

Growth in half year ended Sep 2025 is 27.02% vs -41.67% in Sep 2024

Nine Monthly Results Snapshot (Consolidated) - Dec'25stock-summary

Dec'25
Dec'24
Change(%)
Net Sales
3,129.93
2,935.20
6.63%
Operating Profit (PBDIT) excl Other Income
170.92
142.07
20.31%
Interest
29.99
34.89
-14.04%
Exceptional Items
0.00
0.00
Consolidate Net Profit
94.67
68.36
38.49%
Operating Profit Margin (Excl OI)
5.46%
4.84%
0.62%
Values in Rs Cr.
Direction Arrows
Net Sales

YoY Growth in nine months ended Dec 2025 is 6.63% vs -7.52% in Dec 2024

Direction Arrows
Consolidated Net Profit

YoY Growth in nine months ended Dec 2025 is 38.49% vs -47.97% in Dec 2024

Annual Results Snapshot (Consolidated) - Mar'26stock-summary

Mar'26
Mar'25
Change(%)
Net Sales
4,241.18
3,896.93
8.83%
Operating Profit (PBDIT) excl Other Income
234.47
175.66
33.48%
Interest
37.59
48.40
-22.33%
Exceptional Items
0.00
0.00
Consolidate Net Profit
135.37
80.06
69.09%
Operating Profit Margin (Excl OI)
5.53%
4.51%
1.02%
Values in Rs Cr.
Direction Arrows
Net Sales

YoY Growth in year ended Mar 2026 is 8.83% vs -5.26% in Mar 2025

Direction Arrows
Consolidated Net Profit

YoY Growth in year ended Mar 2026 is 69.09% vs -43.03% in Mar 2025

stock-summaryCompany CV
About Gandhar Oil Refinery (India) Ltd stock-summary
stock-summary
Gandhar Oil Refinery (India) Ltd
Micro Cap
Oil
Gandhar Oil Refinery (India) Limited was incorporated as a Private Company as `Gandhar Oil Refinery (India) Private Limited' on October 7, 1992. Subsequently, the name of the Company changed to `Sunoco Industries Private Limited' on March 16, 2004. Thereafter, it changed the status into a Public Company retaining the name as `Gandhar Oil Refinery (India) Limited' on August 22, 2005.
Company Coordinates stock-summary
Icon
No Company Details Available