
Compare Gandhar Oil Ref. with Similar Stocks
Total Returns (Price + Dividend) 
Latest dividend: 0.7390133333333334 per share ex-dividend date: Jan-30-2026
Risk Adjusted Returns v/s
Returns Beta

News
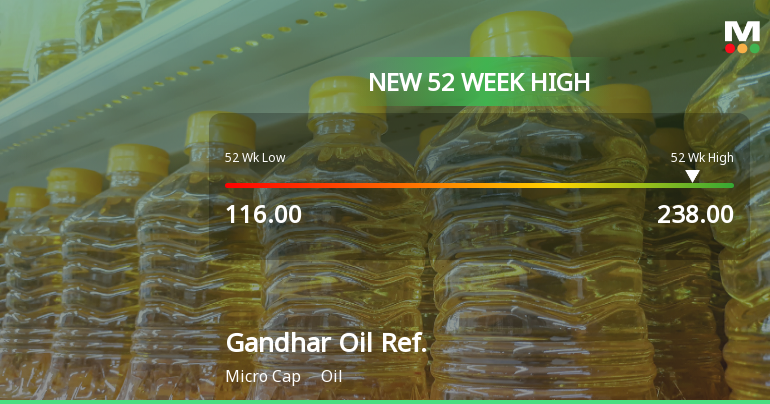
Broad-Based Technical Strength Lifts Gandhar Oil Refinery (India) Ltd to 52-Week High of Rs 238
With a decisive break above Rs 238 on 21 Jul 2026, Gandhar Oil Refinery (India) Ltd has reached a fresh 52-week high, extending its impressive 34.7% return over the past year and outpacing the Sensex’s decline of 5.6%. This milestone reflects a confluence of strong technical signals and sustained price momentum that have propelled the stock well beyond its 52-week low of Rs 116.
Read full news article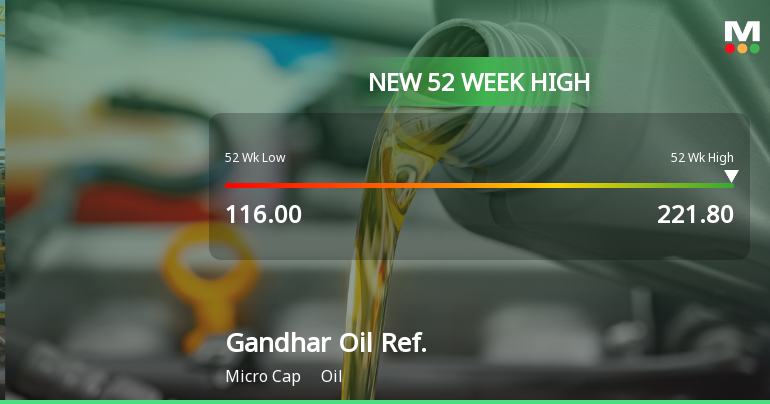
Broad-Based Technical Strength Lifts Gandhar Oil Refinery (India) Ltd to 52-Week High of Rs 221.8
With a decisive surge to Rs 221.8 on 20 Jul 2026, Gandhar Oil Refinery (India) Ltd has reached a fresh 52-week high, marking a 31.45% gain over the past year and outpacing the Sensex’s decline of 5.16%. This milestone reflects a strong alignment of technical indicators and sustained price momentum despite a broadly negative market backdrop.
Read full news article
Gandhar Oil Refinery (India) Ltd is Rated Buy
Gandhar Oil Refinery (India) Ltd is rated 'Buy' by MarketsMOJO, with this rating last updated on 08 June 2026. However, the analysis and financial metrics discussed here reflect the stock's current position as of 17 July 2026, providing investors with the most up-to-date insights.
Read full news article Announcements
Announcement under Regulation 30 (LODR)-Analyst / Investor Meet - Intimation
18-Jul-2026 | Source : BSEPursuant to regulation 30 of the SEBI (LODR) 2015 we hereby inform you that the company has scheduled an earnings call with the Analyst/Investors on Thursday July 23 2026 at 11.00 a.m. (IST) to discuss Un-audited financial results (Standalone & Consolidated) for the quarter ended June 30 2026 (Q1 FY 2026-27).
Announcement under Regulation 30 (LODR)-Newspaper Publication
17-Jul-2026 | Source : BSEPursuant to Regulation 30 and 47 of the SEBI(LODR) 2015 we are enclosing herewith the copies of newspaper advertisement with respect to the notice of postal ballot dated July 15th 2026 published today i.e. July 17th 2026 in the following newspapers: 1. Business standard (English newspaper) 2. Dainik Nalanda express (Marathi newspaper). kindly take the above information in your records.
Shareholder Meeting / Postal Ballot-Notice of Postal Ballot
16-Jul-2026 | Source : BSEPlease find enclosed Postal Ballot Notice dated July 15th 2026 (Notice) along with Explanatory Statement seeking approval of Members of the Company to transact special business as set out below by way of Postal Ballot only through electronic means (remote e-voting).
Corporate Actions

22 Jul 2026

Gandhar Oil Refinery (India) Ltd has declared 37% dividend, ex-date: 30 Jan 26

No Splits history available

No Bonus history available

No Rights history available
Quality key factors
Valuation key factors
Technicals key factors
 Technical Indicator Scale: Bearish, Mildly Bearish, Sideways, Mildly Bullish, Bullish Turned
 Shareholding Snapshot : Mar 2026
Shareholding Compare (%holding)
Promoters
None
Held by 0 Schemes
Held by 10 FIIs (0.14%)
Ramesh Babulal Parekh (28.62%)
Bandhan Amc Limited (2.25%)
26.27%
Quarterly Results Snapshot (Consolidated) - Mar'26 - QoQ

QoQ Growth in quarter ended Mar 2026 is -6.31% vs 10.11% in Dec 2025

QoQ Growth in quarter ended Mar 2026 is 25.59% vs -10.15% in Dec 2025
Half Yearly Results Snapshot (Consolidated) - Sep'25
Growth in half year ended Sep 2025 is 1.71% vs -6.83% in Sep 2024
Growth in half year ended Sep 2025 is 27.02% vs -41.67% in Sep 2024
Nine Monthly Results Snapshot (Consolidated) - Dec'25
YoY Growth in nine months ended Dec 2025 is 6.63% vs -7.52% in Dec 2024
YoY Growth in nine months ended Dec 2025 is 38.49% vs -47.97% in Dec 2024
Annual Results Snapshot (Consolidated) - Mar'26
YoY Growth in year ended Mar 2026 is 8.83% vs -5.26% in Mar 2025
YoY Growth in year ended Mar 2026 is 69.09% vs -43.03% in Mar 2025
About Gandhar Oil Refinery (India) Ltd

Company Coordinates


