
Compare Gandhar Oil Ref. with Similar Stocks
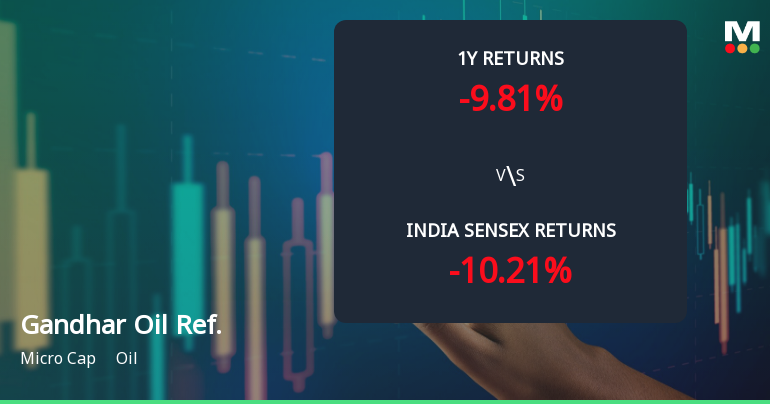
Total Returns (Price + Dividend) 
Latest dividend: 0.74 per share ex-dividend date: Jan-30-2026
Risk Adjusted Returns v/s
Returns Beta

News
Gandhar Oil Refinery (India) Ltd Technical Momentum Shifts Amid Mixed Market Signals
Gandhar Oil Refinery (India) Ltd has experienced a nuanced shift in its technical momentum, moving from a bullish to a mildly bullish trend as of early June 2026. Despite a recent downgrade in daily price performance, key technical indicators such as MACD and moving averages continue to signal underlying strength, while others like RSI and KST present cautionary notes. This article analyses the evolving technical landscape of this oil sector micro-cap, providing investors with a comprehensive view of its price dynamics and momentum.
Read full news article
Gandhar Oil Refinery (India) Ltd Shows Technical Momentum Shift Amid Mixed Returns
Gandhar Oil Refinery (India) Ltd has experienced a notable shift in its technical momentum, moving from a mildly bearish stance to a more bullish outlook across key indicators. Despite this positive technical transition, the micro-cap oil company’s recent returns remain mixed when compared to broader market benchmarks such as the Sensex, reflecting a complex investment landscape for shareholders.
Read full news article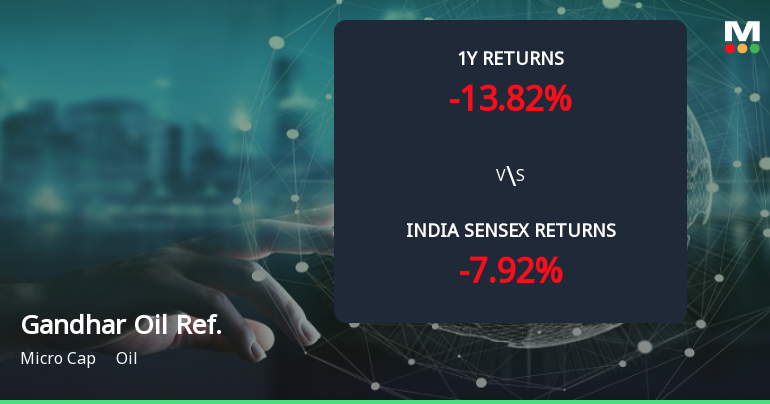
Golden Cross Confirmed: Do Gandhar Oil Refinery (India) Ltd's Other Technical Indicators Agree?
The 50-day moving average for Gandhar Oil Refinery (India) Ltd has crossed above the 200-day moving average, signalling a golden cross on 3 Jun 2026. Yet, the broader technical and fundamental context presents a nuanced picture that challenges a straightforward bullish interpretation.
Read full news article Announcements
Announcement under Regulation 30 (LODR)-Analyst / Investor Meet - Intimation
08-Jun-2026 | Source : BSEPursuant to Regulation 30 SEBI (Listing Obligations and Disclosure Requirements) Regulations 2015 (Listing Regulations) this is to inform you that Gandhar Oil Refinery (India) Limited (the Company) through its representatives will be participating in Choice Equity Broking Pvt. Ltd. InsightX 2026 - Investor Conference/Meet on Thursday June 11 2026 at 4:00 p.m. through virtual mode.
Announcement under Regulation 30 (LODR)-Earnings Call Transcript
02-Jun-2026 | Source : BSEPursuant to Regulation 30 of SEBI (LODR) Regulation 2015 in furtherance to our letter dated May 27 2026 regarding the audio recording of the Analysts/ Investors Earnings Call for the quarter and financial year ended March 31 2026 (Q4 FY 2025-26) please find enclosed herewith transcript of the said call.
Disclosure Under Regulation 30 Of The Securities And Exchange Board Of India (Listing Obligations And Disclosure Requirements) Regulations 2015 For An Order Received From The Office Of The Commissioner Of Customs (Import - II)
30-May-2026 | Source : BSEPursuant to Regulation 30 read with Clause 20 of Para A of Part A of Schedule III of SEBI (LODR) Regulation 2015 (Listing Regulations) the Company has received refund sanctioned order issued by Office of the Commissioner of Customs (Imports - II)
Corporate Actions

No Upcoming Board Meetings

Gandhar Oil Refinery (India) Ltd has declared 37% dividend, ex-date: 30 Jan 26

No Splits history available

No Bonus history available

No Rights history available
Quality key factors
Valuation key factors
Technicals key factors
 Technical Indicator Scale: Bearish, Mildly Bearish, Sideways, Mildly Bullish, Bullish Turned
 Shareholding Snapshot : Mar 2026
Shareholding Compare (%holding)
Promoters
None
Held by 0 Schemes
Held by 10 FIIs (0.14%)
Ramesh Babulal Parekh (28.62%)
Bandhan Amc Limited (2.25%)
26.27%
Quarterly Results Snapshot (Consolidated) - Mar'26 - QoQ

QoQ Growth in quarter ended Mar 2026 is -6.31% vs 10.11% in Dec 2025

QoQ Growth in quarter ended Mar 2026 is 25.59% vs -10.15% in Dec 2025
Half Yearly Results Snapshot (Consolidated) - Sep'25
Growth in half year ended Sep 2025 is 1.71% vs -6.83% in Sep 2024
Growth in half year ended Sep 2025 is 27.02% vs -41.67% in Sep 2024
Nine Monthly Results Snapshot (Consolidated) - Dec'25
YoY Growth in nine months ended Dec 2025 is 6.63% vs -7.52% in Dec 2024
YoY Growth in nine months ended Dec 2025 is 38.49% vs -47.97% in Dec 2024
Annual Results Snapshot (Consolidated) - Mar'26
YoY Growth in year ended Mar 2026 is 8.83% vs -5.26% in Mar 2025
YoY Growth in year ended Mar 2026 is 69.09% vs -43.03% in Mar 2025
About Gandhar Oil Refinery (India) Ltd

Company Coordinates


