
Compare Ganesh Housing with Similar Stocks
Dashboard
With a fall in Operating Profit of -56.18%, the company declared Very Negative results in Mar 26
- The company has declared negative results for the last 4 consecutive quarters
- The company has declared negative results in Jun 25 after 3 consecutive negative quarters
- NET SALES(Q) At Rs 95.06 cr has Fallen at -62.19%
- PBT LESS OI(Q) At Rs 69.00 cr has Fallen at -67.73%
- PAT(Q) At Rs 61.36 cr has Fallen at -62.8%
With ROCE of 16.1, it has a Very Expensive valuation with a 2.6 Enterprise value to Capital Employed
Despite the size of the company, domestic mutual funds hold only 0% of the company
Underperformed the market in the last 1 year
Total Returns (Price + Dividend) 
Latest dividend: 5 per share ex-dividend date: Aug-29-2025
Risk Adjusted Returns v/s
Returns Beta

News

Ganesh Housing Corporation Ltd is Rated Strong Sell
Ganesh Housing Corporation Ltd is rated Strong Sell by MarketsMOJO. This rating was last updated on 21 July 2025. However, the analysis and financial metrics presented here reflect the stock’s current position as of 14 June 2026, providing investors with an up-to-date perspective on the company’s fundamentals, valuation, financial trends, and technical outlook.
Read full news article
Ganesh Housing Corporation Ltd is Rated Strong Sell
Ganesh Housing Corporation Ltd is rated Strong Sell by MarketsMOJO. This rating was last updated on 21 July 2025, reflecting a significant reassessment of the stock’s outlook. However, all fundamentals, returns, and financial metrics discussed below are current as of 03 June 2026, providing investors with an up-to-date view of the company’s position.
Read full news article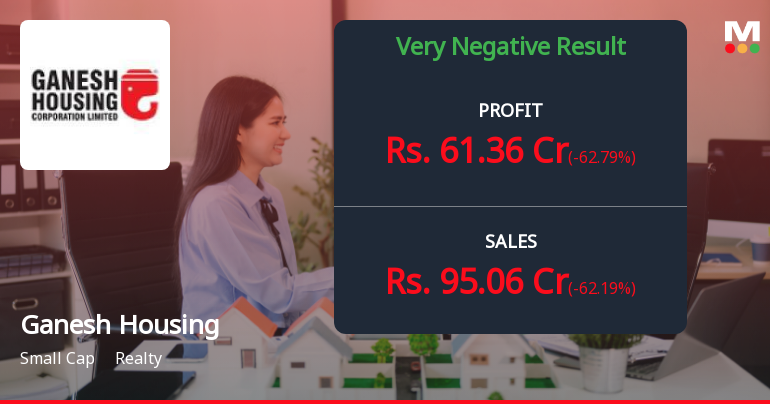
Ganesh Housing Q4 FY26: Revenue Plummets 62% as Real Estate Cycle Turns
Ganesh Housing Corporation Ltd., the Ahmedabad-based real estate developer, reported a sharp contraction in its fourth quarter FY26 results, with net profit declining 62.79% year-on-year to ₹61.36 crores. The company, which commands a market capitalisation of ₹5,846 crores, saw revenues collapse to ₹95.06 crores in the March 2026 quarter, down 62.19% from ₹251.39 crores in the corresponding period last year. The stock has struggled in recent months, trading at ₹705.75 as of May 29, 2026, down 30.74% over the past year and significantly below its 52-week high of ₹1,077.30.
Read full news article Announcements
Ganesh Housing Corporation Limited - Other General Purpose
28-Nov-2019 | Source : NSEGanesh Housing Corporation Limited has submitted to the Exchange a copy of Disclosure under Regulation 23(9) of Securities and Exchange Board of India (Listing Obligations and Disclosure Requirements) Regulations, 2015 for half year ended September 30, 2019.
Ganesh Housing Corporation Limited - Credit Rating
26-Nov-2019 | Source : NSEGanesh Housing Corporation Limited has informed the Exchange regarding Credit Rating
Price movement
18-Sep-2019 | Source : NSE
| Significant movement in price has been observed in Ganesh Housing Corporation Limited. The Exchange, in order to ensure that investors have latest relevant information about the company and to inform the market place so that the interest of the investors is safeguarded, had written to the company. Ganesh Housing Corporation Limited has submitted their response. |
Corporate Actions

No Upcoming Board Meetings

Ganesh Housing Corporation Ltd has declared 50% dividend, ex-date: 29 Aug 25

No Splits history available

Ganesh Housing Corporation Ltd has announced 1:2 bonus issue, ex-date: 14 Jul 16

No Rights history available
Quality key factors
Valuation key factors
Technicals key factors
 Technical Indicator Scale: Bearish, Mildly Bearish, Sideways, Mildly Bullish, Bullish Turned
 Shareholding Snapshot : Mar 2026
Shareholding Compare (%holding)
Promoters
None
Held by 1 Schemes (0.0%)
Held by 46 FIIs (0.7%)
Shekhar Govindbhai Patel (34.97%)
Nrupal Dhanpal Shah On Behalf Of Nds Family Discretionary Trust (3.76%)
12.37%
Quarterly Results Snapshot (Consolidated) - Mar'26 - YoY

YoY Growth in quarter ended Mar 2026 is -62.19% vs -9.17% in Mar 2025
YoY Growth in quarter ended Mar 2026 is -62.79% vs 46.19% in Mar 2025
Half Yearly Results Snapshot (Consolidated) - Sep'25
Growth in half year ended Sep 2025 is -27.99% vs 4.05% in Sep 2024
Growth in half year ended Sep 2025 is -26.13% vs 10.10% in Sep 2024
Nine Monthly Results Snapshot (Consolidated) - Dec'25
YoY Growth in nine months ended Dec 2025 is -41.23% vs 15.14% in Dec 2024
YoY Growth in nine months ended Dec 2025 is -41.16% vs 24.50% in Dec 2024
Annual Results Snapshot (Consolidated) - Mar'26
YoY Growth in year ended Mar 2026 is -46.72% vs 7.60% in Mar 2025
YoY Growth in year ended Mar 2026 is -47.12% vs 29.81% in Mar 2025
About Ganesh Housing Corporation Ltd

Company Coordinates


