
Compare Ganga Forging with Similar Stocks
Dashboard
With a Operating Losses, the company has a Weak Long Term Fundamental Strength
- Low ability to service debt as the company has a high Debt to EBITDA ratio of -12.77 times
- The company has been able to generate a Return on Equity (avg) of 4.60% signifying low profitability per unit of shareholders funds
Flat results in Mar 26
Risky - Negative EBITDA
Below par performance in long term as well as near term
Stock DNA
Castings & Forgings
INR 65 Cr (Micro Cap)
NA (Loss Making)
50
0.00%
0.58
-13.88%
2.28
Total Returns (Price + Dividend) 
Ganga Forging for the last several years.
Risk Adjusted Returns v/s
Returns Beta

News
Are Ganga Forging Ltd latest results good or bad?
Ganga Forging Ltd's latest financial results for Q1 FY27 present a mixed picture of performance. The company reported a net profit of ₹1.06 crores, a significant turnaround from a loss of ₹0.29 crores in the same quarter last year, indicating a return to profitability. This improvement in net profit is accompanied by an operating margin of 9.46%, which is a notable increase from -0.77% in Q1 FY26, suggesting enhanced cost management and operational efficiency. However, the revenue figures tell a different story. The company's net sales for the quarter were ₹7.19 crores, reflecting a substantial decline of 32.99% from the previous quarter's ₹10.73 crores and a 7.23% decrease year-on-year. This contraction in revenue raises concerns about potential demand weakness and market share losses, as it marks the lowest quarterly sales figure in recent periods. The financial performance indicates that while Ganga Fo...
Read full news article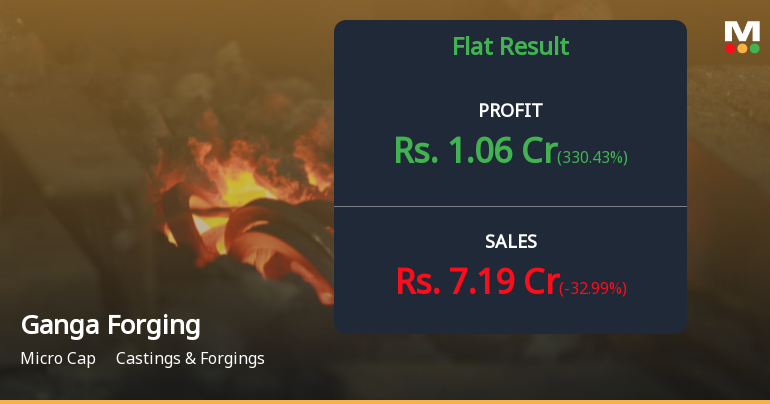
Ganga Forging Q1 FY27: Profit Surge Masks Deeper Revenue Concerns
Ganga Forging Ltd., a micro-cap player in the castings and forgings industry with a market capitalisation of ₹65.00 crores, posted a net profit of ₹1.06 crores in Q1 FY27, marking a dramatic turnaround from the ₹0.29 crore loss recorded in Q1 FY26. However, this profitability improvement came against a backdrop of declining revenues, raising questions about the sustainability of this performance and the underlying operational health of the business.
Read full news articleAre Ganga Forging Ltd latest results good or bad?
Ganga Forging Ltd's latest financial results for Q4 FY26 highlight significant operational challenges. The company reported net sales of ₹10.73 crores, reflecting a quarter-on-quarter growth of 20.83% compared to ₹8.88 crores in Q3 FY26. However, this performance is overshadowed by a year-on-year decline of 6.94% from ₹11.53 crores in Q4 FY25. The net profit for the quarter was a loss of ₹0.46 crores, which is a deterioration from a profit of ₹0.04 crores in the previous quarter, indicating ongoing profitability struggles. The operating margin turned negative at -0.84%, a stark contrast to the positive 5.12% margin reported in the same quarter last year. This decline suggests that cost pressures have intensified, leading to operational inefficiencies that the company has not been able to mitigate effectively. Return on Equity (ROE) stands at a negative -14.23%, which raises concerns about the company's a...
Read full news article Announcements
Ganga Forging Limited - Clarification - Financial Results
03-Dec-2019 | Source : NSEGanga Forging Limiteding Limited for the quarter ended 30-Sep-2019 with respect to Regulation 33 of the SEBI (Listing Obligations and Disclosure Requirements) Regulations, 2015.
Ganga Forging Limited - Outcome of Board Meeting
15-Nov-2019 | Source : NSEGanga Forging Limited has informed the Exchange regarding Board meeting held on November 14, 2019.
Ganga Forging Limited - Updates
22-Oct-2019 | Source : NSEGanga Forging Limited has informed the Exchange regarding 'Submission of Certificate under Reg 74(5) of SEBI (Depositories and Participants), Regulations, 2018'.
Corporate Actions

No Upcoming Board Meetings

No Dividend history available

Ganga Forging Ltd has announced 1:10 stock split, ex-date: 13 Sep 21

Ganga Forging Ltd has announced 1:3 bonus issue, ex-date: 11 Jan 21

Ganga Forging Ltd has announced 3:2 rights issue, ex-date: 02 Jul 26
Quality key factors
Valuation key factors
Technicals key factors
 Technical Indicator Scale: Bearish, Mildly Bearish, Sideways, Mildly Bullish, Bullish Turned
 Shareholding Snapshot : Mar 2026
Shareholding Compare (%holding)
Non Institution
None
Held by 0 Schemes
Held by 0 FIIs
Hiralal Mahidas Tilva (10.01%)
None
58.95%
Quarterly Results Snapshot (Standalone) - Jun'26 - QoQ

QoQ Growth in quarter ended Jun 2026 is -32.99% vs 20.83% in Mar 2026

QoQ Growth in quarter ended Jun 2026 is 330.43% vs -1,250.00% in Mar 2026
Half Yearly Results Snapshot (Standalone) - Sep'25
Growth in half year ended Sep 2025 is -20.03% vs 8.63% in Sep 2024
Growth in half year ended Sep 2025 is -666.67% vs 67.65% in Sep 2024
Nine Monthly Results Snapshot (Standalone) - Dec'25
YoY Growth in nine months ended Dec 2025 is -21.46% vs 17.46% in Dec 2024
YoY Growth in nine months ended Dec 2025 is -479.76% vs 47.37% in Dec 2024
Annual Results Snapshot (Standalone) - Mar'26
YoY Growth in year ended Mar 2026 is -17.58% vs 16.15% in Mar 2025
YoY Growth in year ended Mar 2026 is -698.36% vs 38.64% in Mar 2025
About Ganga Forging Ltd

Company Coordinates


