
Compare Ganga Forging with Similar Stocks
Dashboard
With a Operating Losses, the company has a Weak Long Term Fundamental Strength
- Low ability to service debt as the company has a high Debt to EBITDA ratio of -12.77 times
- The company has been able to generate a Return on Equity (avg) of 4.60% signifying low profitability per unit of shareholders funds
Flat results in Mar 26
Risky - Negative EBITDA
Below par performance in long term as well as near term
Stock DNA
Castings & Forgings
INR 32 Cr (Micro Cap)
NA (Loss Making)
46
0.00%
0.58
-13.88%
1.13
Total Returns (Price + Dividend) 
Ganga Forging for the last several years.
Risk Adjusted Returns v/s
Returns Beta

News
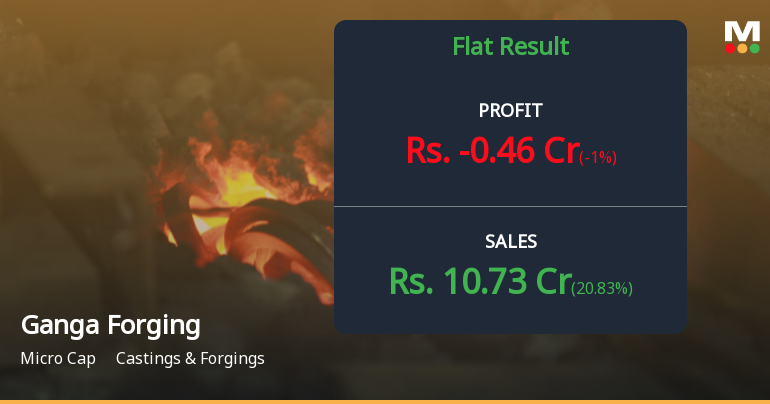
Ganga Forging Q4 FY26: Mounting Losses Signal Deep Operational Distress
Ganga Forging Ltd., a micro-cap player in the castings and forgings sector, reported a quarterly net loss of ₹0.46 crores for Q4 FY26, marking a sharp deterioration from the marginal ₹0.04 crores profit recorded in Q3 FY26. The ₹32.00 crores market capitalisation company has slipped into negative territory despite a 20.83% sequential revenue uptick to ₹10.73 crores, as operational inefficiencies and margin compression continue to plague the business. The stock, currently trading at ₹2.36, has plunged 45.24% over the past year and remains entrenched in a bearish technical trend, reflecting mounting investor scepticism about the company's ability to restore profitability.
Read full news article
Ganga Forging Ltd is Rated Strong Sell
Ganga Forging Ltd is rated Strong Sell by MarketsMOJO, with this rating last updated on 28 May 2024. However, the analysis and financial metrics discussed here reflect the company’s current position as of 28 May 2026, providing investors with an up-to-date view of the stock’s fundamentals, valuation, financial trends, and technical outlook.
Read full news article
Ganga Forging Ltd is Rated Strong Sell
Ganga Forging Ltd is rated Strong Sell by MarketsMOJO. This rating was last updated on 28 May 2024, reflecting a significant reassessment of the stock’s outlook. However, the analysis and financial metrics presented here are based on the company’s current position as of 13 May 2026, providing investors with the latest insights into its performance and prospects.
Read full news article Announcements
Ganga Forging Limited - Clarification - Financial Results
03-Dec-2019 | Source : NSEGanga Forging Limiteding Limited for the quarter ended 30-Sep-2019 with respect to Regulation 33 of the SEBI (Listing Obligations and Disclosure Requirements) Regulations, 2015.
Ganga Forging Limited - Outcome of Board Meeting
15-Nov-2019 | Source : NSEGanga Forging Limited has informed the Exchange regarding Board meeting held on November 14, 2019.
Ganga Forging Limited - Updates
22-Oct-2019 | Source : NSEGanga Forging Limited has informed the Exchange regarding 'Submission of Certificate under Reg 74(5) of SEBI (Depositories and Participants), Regulations, 2018'.
Corporate Actions

(11 Jun 2026)

No Dividend history available

Ganga Forging Ltd has announced 1:10 stock split, ex-date: 13 Sep 21

Ganga Forging Ltd has announced 1:3 bonus issue, ex-date: 11 Jan 21

No Rights history available
Quality key factors
Valuation key factors
Technicals key factors
 Technical Indicator Scale: Bearish, Mildly Bearish, Sideways, Mildly Bullish, Bullish Turned
 Shareholding Snapshot : Mar 2026
Shareholding Compare (%holding)
Non Institution
None
Held by 0 Schemes
Held by 0 FIIs
Hiralal Mahidas Tilva (10.01%)
None
58.95%
Quarterly Results Snapshot (Standalone) - Mar'26 - QoQ

QoQ Growth in quarter ended Mar 2026 is 20.83% vs 7.38% in Dec 2025

QoQ Growth in quarter ended Mar 2026 is -1,250.00% vs 101.36% in Dec 2025
Half Yearly Results Snapshot (Standalone) - Sep'25
Growth in half year ended Sep 2025 is -20.03% vs 8.63% in Sep 2024
Growth in half year ended Sep 2025 is -666.67% vs 67.65% in Sep 2024
Nine Monthly Results Snapshot (Standalone) - Dec'25
YoY Growth in nine months ended Dec 2025 is -21.46% vs 17.46% in Dec 2024
YoY Growth in nine months ended Dec 2025 is -479.76% vs 47.37% in Dec 2024
Annual Results Snapshot (Standalone) - Mar'26
YoY Growth in year ended Mar 2026 is -17.58% vs 16.15% in Mar 2025
YoY Growth in year ended Mar 2026 is -698.36% vs 38.64% in Mar 2025
About Ganga Forging Ltd

Company Coordinates


