
Compare Ganga Papers with Similar Stocks
Dashboard
Weak Long Term Fundamental Strength with a -2.53% CAGR growth in Operating Profits over the last 5 years
- Low ability to service debt as the company has a high Debt to EBITDA ratio of 6.35 times
- The company has been able to generate a Return on Capital Employed (avg) of 9.01% signifying low profitability per unit of total capital (equity and debt)
Below par performance in long term as well as near term
Stock DNA
Paper, Forest & Jute Products
INR 68 Cr (Micro Cap)
43.00
17
0.00%
1.27
5.12%
2.21
Total Returns (Price + Dividend) 
Ganga Papers for the last several years.
Risk Adjusted Returns v/s
Returns Beta

News
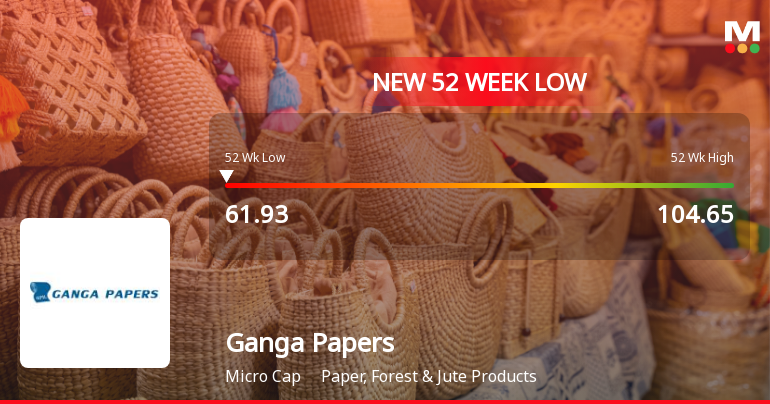
Markets Rally, But Ganga Papers India Ltd Sinks to 52-Week Low in Stock-Specific Sell-Off
While the broader market showed signs of resilience, Ganga Papers India Ltd succumbed to selling pressure, hitting a fresh 52-week low of Rs 61.93 on 09 Jun 2026. This decline marks a significant divergence from the Sensex, which opened higher and remains within striking distance of its own 52-week lows.
Read full news article
Ganga Papers India Ltd Downgraded to Strong Sell Amid Mixed Financial and Technical Signals
Ganga Papers India Ltd has seen its investment rating upgraded from Sell to Strong Sell as of 2 June 2026, reflecting a nuanced shift in its financial and valuation parameters despite ongoing challenges in technical trends and long-term fundamentals. The paper industry player’s recent quarterly results and valuation metrics have improved, yet persistent weaknesses in technical indicators and long-term growth prospects continue to weigh on investor sentiment.
Read full news article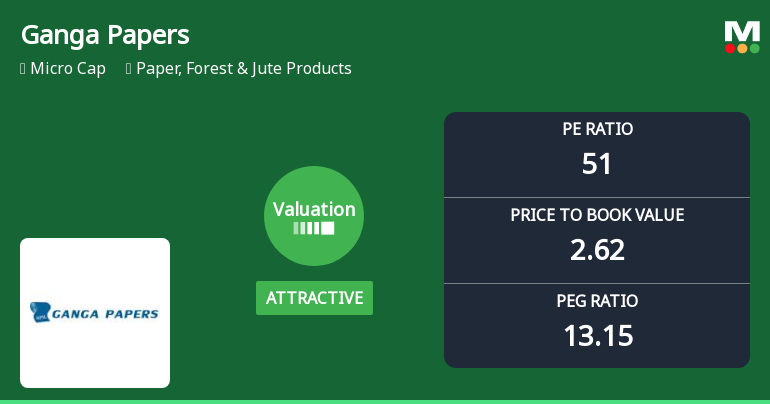
Ganga Papers India Ltd Valuation Shifts Signal Renewed Price Attractiveness
Ganga Papers India Ltd has witnessed a notable shift in its valuation parameters, moving from a fair to an attractive rating, despite a recent 5.0% drop in its share price. This change reflects evolving market perceptions amid mixed financial metrics and peer comparisons within the Paper, Forest & Jute Products sector.
Read full news article Announcements
Announcement under Regulation 30 (LODR)-Newspaper Publication
30-May-2026 | Source : BSENewspaper Advertisement for the Audited Financial Results for the quarter and financial year ended March 31 2026.
Compliances-Reg.24(A)-Annual Secretarial Compliance
29-May-2026 | Source : BSEAnnual Secretarial Compliance Report for the year ended March 31 2026.
Financial Results For The Quarter IV And Financial Year Ended 31.03.2026
28-May-2026 | Source : BSEAudited Financial Results for the Quarter IV and Financial Year ended 31.03.2026
Corporate Actions

No Upcoming Board Meetings

No Dividend history available

No Splits history available

No Bonus history available

No Rights history available
Quality key factors
Valuation key factors
Technicals key factors
 Technical Indicator Scale: Bearish, Mildly Bearish, Sideways, Mildly Bullish, Bullish Turned
 Shareholding Snapshot : Mar 2026
Shareholding Compare (%holding)
Promoters
None
Held by 2 Schemes (0.25%)
Held by 0 FIIs
Ganga Pulp And Papers Private Limited (43.31%)
Apex Commotrade Private Limited . (3.29%)
12.44%
Quarterly Results Snapshot (Standalone) - Mar'26 - YoY

YoY Growth in quarter ended Mar 2026 is 18.62% vs 2.85% in Mar 2025
YoY Growth in quarter ended Mar 2026 is 24.59% vs 3.39% in Mar 2025
Half Yearly Results Snapshot (Standalone) - Sep'25
Growth in half year ended Sep 2025 is 8.05% vs 3.32% in Sep 2024

Growth in half year ended Sep 2025 is -6.15% vs 12.07% in Sep 2024
Nine Monthly Results Snapshot (Standalone) - Dec'25
YoY Growth in nine months ended Dec 2025 is 5.48% vs 5.69% in Dec 2024
YoY Growth in nine months ended Dec 2025 is -10.75% vs 4.49% in Dec 2024
Annual Results Snapshot (Standalone) - Mar'26
YoY Growth in year ended Mar 2026 is 8.75% vs 4.97% in Mar 2025
YoY Growth in year ended Mar 2026 is 3.23% vs 4.73% in Mar 2025
About Ganga Papers India Ltd

Company Coordinates


