
Compare Garg Furnace with Similar Stocks
Stock DNA
Iron & Steel Products
INR 79 Cr (Micro Cap)
8.00
26
0.00%
0.09
10.41%
0.79
Total Returns (Price + Dividend) 
Garg Furnace for the last several years.
Risk Adjusted Returns v/s
Returns Beta

News
Garg Furnace Ltd is Rated Sell
Garg Furnace Ltd is rated Sell by MarketsMOJO, with this rating last updated on 04 February 2026. However, the analysis and financial metrics discussed here reflect the stock’s current position as of 04 June 2026, providing investors with an up-to-date perspective on the company’s fundamentals, valuation, financial trend, and technical outlook.
Read full news articleAre Garg Furnace Ltd latest results good or bad?
Garg Furnace Ltd's financial results for the quarter ended March 2026 indicate a challenging operational environment. The company reported consolidated net profit of ₹2.64 crore, reflecting a sequential decline of 29.97% from the previous quarter. This decline in profitability is accompanied by a significant contraction in net sales, which amounted to ₹78.48 crore, down 16.72% from ₹94.24 crore in the prior quarter. This sharp decrease follows a robust performance in the preceding quarter, highlighting volatility in demand for the company's steel products. Despite these challenges, Garg Furnace demonstrated some resilience in operating efficiency, with operating margins improving to 5.36%, up from 4.59% in the previous quarter. This suggests better cost management at the manufacturing level, although it was insufficient to counterbalance the effects of reduced revenue and increased financial costs. Notably...
Read full news article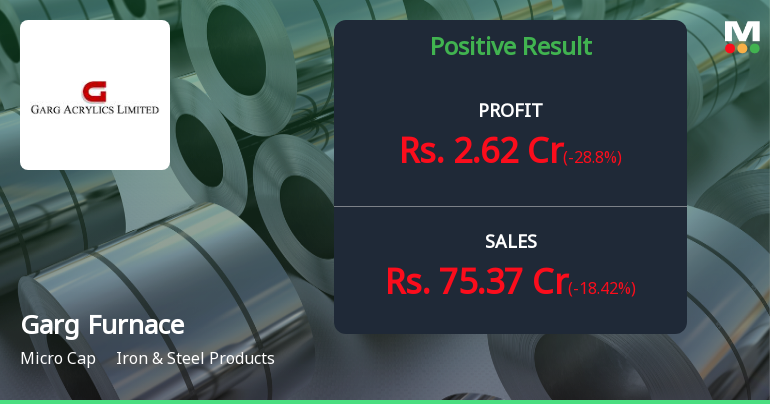
Garg Furnace Q4 FY26: Profit Decline and Technical Weakness Cloud Steel Maker's Outlook
Garg Furnace Ltd., a Punjab-based manufacturer of iron and steel products, reported a concerning 29.97% quarter-on-quarter decline in consolidated net profit to ₹2.64 crores for Q4 FY26 (Mar'26 quarter), raising questions about operational momentum as the company navigates a challenging environment. The ₹79 crore market capitalisation micro-cap steel maker's stock has plunged 32.72% over the past year, significantly underperforming both the Sensex and its sector peers, whilst trading in a bearish technical trend since mid-May 2026.
Read full news article Announcements
Announcement under Regulation 30 (LODR)-Newspaper Publication
03-Jun-2026 | Source : BSENewspaper Publications
Board Meeting Outcome for Audited Financial Results (Standalone And Consolidated) For The Financial Year Ended March 31 2026
30-May-2026 | Source : BSEAudited Financial Results (Standalone and Consolidated) for the financial year ended March 31 2026
Compliances-Reg.24(A)-Annual Secretarial Compliance
30-May-2026 | Source : BSEAnnual Secretarial Compliance Report issued by M/s PDM & Associates for the Financial Year ended March 31 2026
Corporate Actions

No Upcoming Board Meetings

No Dividend history available

No Splits history available

No Bonus history available

No Rights history available
Quality key factors
Valuation key factors
Technicals key factors
 Technical Indicator Scale: Bearish, Mildly Bearish, Sideways, Mildly Bullish, Bullish Turned
 Shareholding Snapshot : Mar 2026
Shareholding Compare (%holding)
Promoters
None
Held by 1 Schemes (0.0%)
Held by 0 FIIs
Vaneera Garg (31.32%)
Securocrop Securities India Private Limited (5.99%)
33.57%
Quarterly Results Snapshot (Standalone) - Mar'26 - QoQ

QoQ Growth in quarter ended Mar 2026 is -18.42% vs 50.52% in Dec 2025
QoQ Growth in quarter ended Mar 2026 is -28.80% vs 34.31% in Dec 2025
Half Yearly Results Snapshot (Standalone) - Sep'25
Growth in half year ended Sep 2025 is -2.37% vs 2.37% in Sep 2024
Growth in half year ended Sep 2025 is 73.48% vs 125.49% in Sep 2024
Nine Monthly Results Snapshot (Standalone) - Dec'25

YoY Growth in nine months ended Dec 2025 is 14.12% vs 0.24% in Dec 2024
YoY Growth in nine months ended Dec 2025 is 76.32% vs 59.93% in Dec 2024
Annual Results Snapshot (Standalone) - Mar'26
YoY Growth in year ended Mar 2026 is 10.58% vs 1.39% in Mar 2025
YoY Growth in year ended Mar 2026 is 34.69% vs 37.41% in Mar 2025
About Garg Furnace Ltd

Company Coordinates


