
Compare Garment Mantra with Similar Stocks
Dashboard
With a Operating Losses, the company has a Weak Long Term Fundamental Strength
- Low ability to service debt as the company has a high Debt to EBITDA ratio of -21.77 times
- The company has been able to generate a Return on Equity (avg) of 5.91% signifying low profitability per unit of shareholders funds
Flat results in Mar 26
Risky - Negative EBITDA
Consistent Underperformance against the benchmark over the last 3 years
Stock DNA
Garments & Apparels
INR 69 Cr (Micro Cap)
22.00
23
0.00%
0.27
3.73%
0.83
Total Returns (Price + Dividend) 
Garment Mantra for the last several years.
Risk Adjusted Returns v/s
Returns Beta

News

Garment Mantra Lifestyle Ltd is Rated Strong Sell
Garment Mantra Lifestyle Ltd is rated Strong Sell by MarketsMOJO, with this rating last updated on 01 June 2026. However, the analysis and financial metrics discussed here reflect the company’s current position as of 04 June 2026, providing investors with the most up-to-date insight into the stock’s performance and outlook.
Read full news article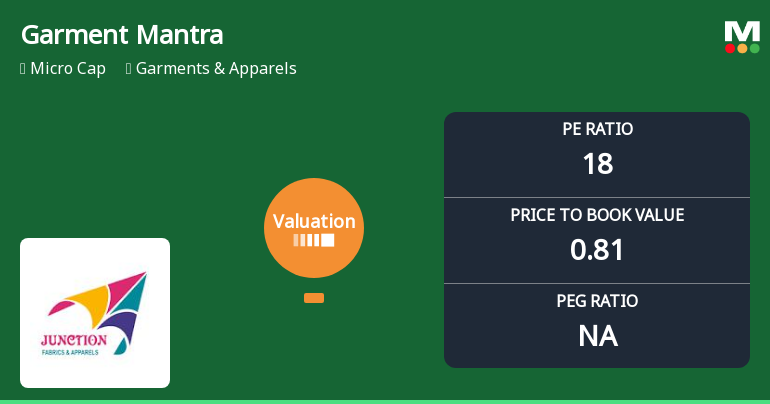
Garment Mantra Lifestyle Ltd Faces Valuation Shift Amidst Market Challenges
Garment Mantra Lifestyle Ltd, a micro-cap player in the Garments & Apparels sector, has seen a marked deterioration in its valuation attractiveness, with key metrics signalling increased risk for investors. The company’s price-to-earnings (P/E) ratio now stands at 17.91, while its price-to-book value (P/BV) has slipped to 0.81, reflecting a shift from previously very attractive levels to a riskier valuation profile amid challenging market conditions and sectoral pressures.
Read full news articleAre Garment Mantra Lifestyle Ltd latest results good or bad?
Garment Mantra Lifestyle Ltd's latest financial results for Q4 FY26 reveal significant operational challenges despite a notable increase in sales. The company reported net sales of ₹60.93 crores, reflecting a year-on-year growth of 73.89% from ₹35.04 crores in Q4 FY25. However, this revenue growth was overshadowed by a substantial net loss of ₹4.91 crores, marking a decline of 477.69% compared to the previous year. The operating margin, excluding other income, deteriorated to -13.23%, which is the lowest recorded margin, indicating severe profitability issues. This contrasts sharply with the positive operating margin of 4.47% achieved in Q3 FY26. Additionally, the profit after tax (PAT) margin fell to -8.07%, down from 4.32% in the previous quarter, highlighting a significant decline in profitability. The company's financial performance indicates a concerning trend, as the sequential revenue decline of 3...
Read full news article Announcements
Announcement under Regulation 30 (LODR)-Monthly Business Updates
02-Jun-2026 | Source : BSEPursuant to Regulation 30 of SEBI(LODR) the business update is submitted herewith
Announcement under Regulation 30 (LODR)-Newspaper Publication
01-Jun-2026 | Source : BSEThe newspaper publication of financial results(standalone and consolidation) for the quarter and year ended 31st March 2026 is submitted herewith
Announcement under Regulation 30 (LODR)-Change in Management
30-May-2026 | Source : BSEThe board of directors in their meeting held today has appointed Mrs. Nisha. S as internal auditor of the company from FY 2026-27 till 2029-30
Corporate Actions

No Upcoming Board Meetings

No Dividend history available

Garment Mantra Lifestyle Ltd has announced 1:10 stock split, ex-date: 18 May 22

Garment Mantra Lifestyle Ltd has announced 1:1 bonus issue, ex-date: 03 Sep 24

Garment Mantra Lifestyle Ltd has announced 39:20 rights issue, ex-date: 17 Apr 25
Quality key factors
Valuation key factors
Technicals key factors
 Technical Indicator Scale: Bearish, Mildly Bearish, Sideways, Mildly Bullish, Bullish Turned
 Shareholding Snapshot : May 2026
Shareholding Compare (%holding)
Non Institution
None
Held by 0 Schemes
Held by 1 FIIs (0.2%)
Prem Aggarwal (27.49%)
None
53.4%
Quarterly Results Snapshot (Consolidated) - Mar'26 - YoY

YoY Growth in quarter ended Mar 2026 is 73.89% vs -50.18% in Mar 2025

YoY Growth in quarter ended Mar 2026 is -477.69% vs 251.35% in Mar 2025
Half Yearly Results Snapshot (Consolidated) - Sep'25
Growth in half year ended Sep 2025 is 35.68% vs 24.60% in Sep 2024
Growth in half year ended Sep 2025 is 268.35% vs 95.77% in Sep 2024
Nine Monthly Results Snapshot (Consolidated) - Dec'25
YoY Growth in nine months ended Dec 2025 is 106.52% vs 3.81% in Dec 2024
YoY Growth in nine months ended Dec 2025 is 498.09% vs -21.89% in Dec 2024
Annual Results Snapshot (Consolidated) - Mar'26
YoY Growth in year ended Mar 2026 is 97.89% vs -19.33% in Mar 2025
YoY Growth in year ended Mar 2026 is 56.10% vs 14.34% in Mar 2025
About Garment Mantra Lifestyle Ltd

Company Coordinates


