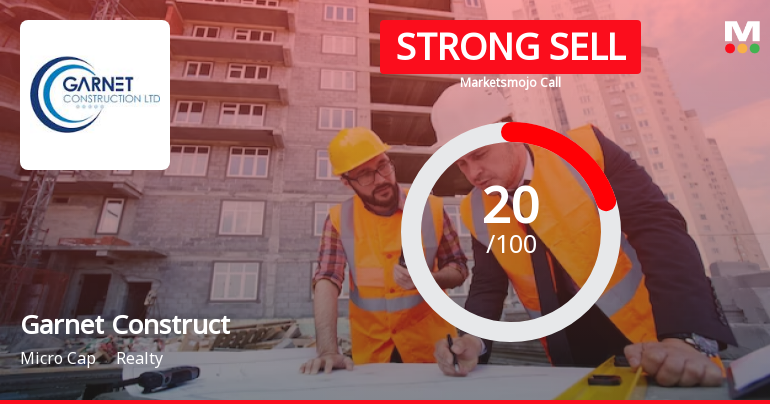
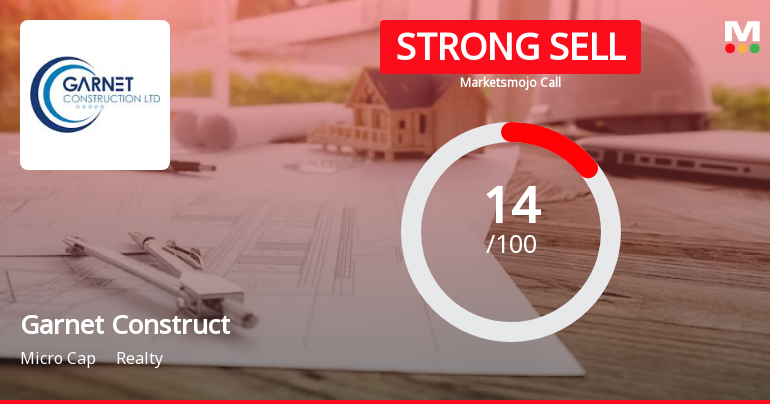
Garnet Construct

  • Market Cap: Micro Cap
  • Industry: Realty
  • ISIN: INE797D01017
  • NSEID:
  • BSEID: 526727
INR
56.97
2.21 (4.04%)
BSENSE

Sep 04, 12:19 PM

BSE+NSE Vol: 1.87 k

  • Price Points
  • Score
  • Mojo Parameters
  • Total Return
  • News and Corporate Actions
  • Key factors
  • Shareholding
  • Financials
  • CompanyCV
stock-summaryPrice Point
High/Low

1Day

52 Week

Valuation
Technical
Day's Volume

CASH

1.87 k (166.49%) Volume

Shareholding (Jun 2026)

FII

0.00%

Held by 0 FIIs

DII

0.00%

Held by 0 DIIs

Promoter

61.29%

Why is Garnet Construction Ltd falling/rising?

04-Sep-2026

As of 03-Sep, Garnet Construction Ltd's stock price is rising to 54.76, reflecting a 6.52% increase. This rise, despite a 17.18% decline over the past month, suggests a positive shift in sentiment, although trading activity is low with a 69.19% drop in delivery volume.

As of 03-Sep, Garnet Construction Ltd's stock price is rising, currently at 54.76, reflecting a change of 3.35 or 6.52% increase. This upward movement is notable as the stock has outperformed its sector by 4.55% today. Additionally, the stock reached an intraday high of Rs 55.9, which represents an increase of 8.73%. <BR><BR>Despite a significant decline in the stock's performance over the past month, where it fell by 17.18%, the current rise indicates a positive shift in investor sentiment or market conditions. However, it is important to note that there has been a decrease in investor participation, with delivery volume dropping by 69.19% against the 5-day average, suggesting that while the price is rising, the overall trading activity may not be robust. <BR><BR>Overall, the stock's current rise can be attributed to today's performance metrics, which show a significant increase compared to the previous day's performance, despite the longer-term trends indicating volatility and declines in other periods.

View full answer

Who are in the management team of Garnet Construct?

01-Sep-2026

The management team of Garnet Construct includes Kishan Kumar Kedia (Chairman & Managing Director), Arun Kedia (Director of Marketing), Sanjay Kumar Kedia (Director of Finance), and three Independent Directors: Shriromani Chauhan, Jitendra Jadhav, and Sirya Vakil Siddiqui, along with Neha Verma (Company Secretary & Compliance Officer). They oversee the company's operations and strategic direction.

The management team of Garnet Construct includes the following individuals:<BR><BR>1. **Kishan Kumar Kedia** - Chairman & Managing Director<BR>2. **Arun Kedia** - Director (Marketing)<BR>3. **Sanjay Kumar Kedia** - Director (Finance)<BR>4. **Shriromani Chauhan** - Independent Director<BR>5. **Jitendra Jadhav** - Independent Director<BR>6. **Sirya Vakil Siddiqui** - Independent Director<BR>7. **Neha Verma** - Company Secretary & Compliance Officer<BR><BR>This team is responsible for overseeing the company's operations and strategic direction.

View full answer

What does Garnet Construct do?

01-Sep-2026

Garnet Construction Ltd is a micro-cap realty company focused on self-funded property development, incorporated in 1992 and listed on Indian stock exchanges. As of June 2026, it reported net sales of 0 Cr and a net profit of -1 Cr, with a market cap of INR 73 Cr.

Overview:<BR>Garnet Construction Ltd is a micro-cap company operating in the realty industry, focusing on self-funded property development.<BR><BR>History:<BR>Garnet Construction Limited was incorporated on October 15, 1992, in Mumbai as a Public Limited Company and was subsequently listed on the National Stock Exchange and Bombay Stock Exchange on December 15, 1994. The latest quarterly results reported net sales and profit for June 2026.<BR><BR>Financial Snapshot:<BR>Most recent Net Sales: 0 Cr (Quarterly Results - Jun 2026) <BR>Most recent Net Profit: -1 Cr (Quarterly Results - Jun 2026) <BR>Market-cap value: INR 73 Cr (Micro Cap)<BR><BR>Key Metrics:<BR>P/E: 4.00 <BR>Industry P/E: 36 <BR>Dividend Yield: 0.00% <BR>Debt-Equity: 0.06 <BR>Return on Equity: 14.20% <BR>Price to Book: 0.52 <BR><BR>Contact Details:<BR>Address: 501/531 Laxmi Mall New Link Rd, Laxmi Indl Estate Andheri (W) Mumbai Maharashtra : 400053 <BR>Tel: 91-22-42578500 <BR>Email: garnet@garnetconstructions.com <BR>Website: http://www.garnetconstructions.com

View full answer

Who are the peers of the Garnet Construct?

01-Sep-2026

Garnet Construct's peers include Shervani Indl Sy, Victoria Mills, Mega Nirman, Landmark Prop., Radhe Develop., H D I L, Parsvnath Devl., Shristi Infra, and Vivid Mercantile. Victoria Mills shows the best management and growth quality, while Garnet Construct has an average growth rate and excellent capital structure, with a 1-year return of 15.33%.

Peers: The peers of Garnet Construct are Shervani Indl Sy, Victoria Mills, Mega Nirman, Landmark Prop., Radhe Develop., H D I L, Parsvnath Devl., Shristi Infra, and Vivid Mercantile.<BR><BR>Quality Snapshot: Excellent management risk is observed at Victoria Mills and Vivid Mercantile, while Average management risk is found at Shervani Indl Sy and H D I L. Below Average management risk is noted at Mega Nirman, Landmark Prop., Radhe Develop., Garnet Construct, Parsvnath Devl., Shristi Infra, and the rest. Growth is Excellent at Victoria Mills and Landmark Prop., Good at Mega Nirman, Average at Radhe Develop. and Garnet Construct, and Below Average at Shervani Indl Sy, H D I L, Parsvnath Devl., Shristi Infra, and the rest. Capital Structure is Excellent at Garnet Construct, Good at Shervani Indl Sy and Victoria Mills, Below Average at Landmark Prop., Radhe Develop., H D I L, Parsvnath Devl., Shristi Infra, and the rest.<BR><BR>Return Snapshot: Victoria Mills has the highest 1-year return at 39.36%, while Parsvnath Devl. has the lowest at -90.11%. Garnet Construct's 1-year return of 15.33% is significantly higher than that of Parsvnath Devl. Negative six-month returns are noted for Shervani Indl Sy, Mega Nirman, H D I L, Parsvnath Devl., and Shristi Infra.

View full answer

How big is Garnet Construct?

01-Sep-2026

As of 31st August, Garnet Construction Ltd has a market capitalization of 73.00 Cr, with recent Net Sales of 44.88 Cr and a Net Profit of 19.10 Cr. Shareholder's Funds are 72.24 Cr and Total Assets amount to 189.63 Cr as of March 2019.

As of 31st August, Garnet Construction Ltd has a market capitalization of 73.00 Cr, categorizing it as a Micro Cap company.<BR><BR>In the latest four quarters, Garnet Construction reported Net Sales of 44.88 Cr and a Net Profit of 19.10 Cr.<BR><BR>The latest annual period for the balance sheet is March 2019, with Shareholder's Funds amounting to 72.24 Cr and Total Assets of 189.63 Cr.

View full answer

Should I buy, sell or hold Garnet Construction Ltd?

16-Aug-2026

When is the next results date for Garnet Construction Ltd?

22-May-2026

The next results date for Garnet Construction Ltd is 30 May 2026.

The next results date for Garnet Construction Ltd is scheduled for 30 May 2026.

View full answer

Is Garnet Construct overvalued or undervalued?

18-Nov-2025

As of November 17, 2025, Garnet Construct is considered an attractive investment due to its strong financial ratios indicating undervaluation, including a PE ratio of 3.98 and an impressive year-to-date return of 97.83%, significantly outperforming its peers and the market.

As of 17 November 2025, Garnet Construct's valuation grade has moved from very attractive to attractive, indicating a shift in market perception. The company is currently assessed as undervalued based on its strong financial ratios, including a PE ratio of 3.98, an EV to EBIT of 3.50, and a PEG ratio of 0.02. These figures suggest that Garnet Construct is trading at a significant discount compared to its earnings potential.<BR><BR>In comparison to its peers, Garnet Construct stands out with a much lower PE ratio than DLF, which has a PE of 43.02, and Lodha Developers at 36.61. Additionally, its EV to EBITDA ratio of 3.46 is considerably more favorable than the industry average, further supporting the undervaluation thesis. The company's recent stock performance has also been impressive, with a year-to-date return of 97.83%, significantly outpacing the Sensex's return of 8.72%, reinforcing the notion that Garnet Construct is a compelling investment opportunity.

View full answer

How has been the historical performance of Garnet Construct?

17-Nov-2025

Garnet Construct has experienced significant declines in net sales, operating income, and profits from March 2016 to March 2019, with net sales dropping from 46.26 Cr to 7.30 Cr and operating profit decreasing from 6.26 Cr to 2.05 Cr. Additionally, cash flow from operating activities turned negative in March 2019, indicating operational challenges.

Answer:<BR>The historical performance of Garnet Construct shows significant fluctuations in key financial metrics over the years.<BR><BR>Breakdown:<BR>Garnet Construct's net sales peaked at 46.26 Cr in March 2016 but have since declined to 7.30 Cr by March 2019. The total operating income followed a similar trend, decreasing from 46.26 Cr in March 2016 to 7.30 Cr in March 2019. Operating profit (PBDIT) also saw a decline from 6.26 Cr in March 2016 to 2.05 Cr in March 2019, with the operating profit margin dropping from 12.49% to 16.99% during the same period. Profit before tax decreased from 2.89 Cr in March 2016 to 1.15 Cr in March 2019, while profit after tax fell from 2.14 Cr to 0.80 Cr. The company's total liabilities decreased from 212.86 Cr in March 2015 to 189.63 Cr in March 2019, and total assets also saw a decline from 196.87 Cr to 189.63 Cr. Cash flow from operating activities turned negative in March 2019, recording -5.00 Cr, contrasting with positive cash flows in previous years. Overall, Garnet Construct has experienced a downward trend in sales, profits, and cash flow, indicating challenges in its operational performance.

View full answer

Are Garnet Construct latest results good or bad?

15-Aug-2025

Garnet Construction's latest results are very positive, with a Profit Before Tax of Rs 24.37 crore, up 1386% from the previous average, and a Profit After Tax of Rs 18.21 crore, reflecting an 883% increase. The company also reported significant growth in net sales and operating profit, indicating strong overall performance.

Garnet Construction's latest results are very positive. For the quarter ending June 2025, the company reported a Profit Before Tax (PBT) of Rs 24.37 crore, which is an astonishing increase of 1386% compared to the average PBT of Rs 1.64 crore from the previous four quarters. Additionally, the Profit After Tax (PAT) rose to Rs 18.21 crore, reflecting an 883% growth from the average PAT of Rs 1.85 crore in the prior four quarters.<BR><BR>The company's net sales for the latest six months reached Rs 39.64 crore, marking a year-on-year increase of 79.85%, significantly surpassing the previous twelve-month sales of Rs 23.70 crore. Furthermore, Garnet Construction achieved its highest operating profit in the last five quarters at Rs 24.63 crore, and the Earnings per Share (EPS) peaked at Rs 13.10.<BR><BR>Overall, these results indicate a strong upward trend in Garnet Construction's operational performance, showcasing substantial growth across key financial metrics.

View full answer

Who are the top shareholders of the Garnet Construct?

17-Jul-2025

The top shareholders of Garnet Construct include Kishan Kumar J Kedia, who holds 29.37%, and Garnet Capital Finance Ltd, the largest public shareholder at 2.98%. Individual investors collectively own 31.66%, with no mutual funds or foreign institutional investors involved.

The top shareholders of Garnet Construct include the promoters, who hold the majority of the shares. The promoter with the highest holding is Kishan Kumar J Kedia, owning 29.37% of the company. Additionally, Garnet Capital Finance Ltd is the highest public shareholder, holding 2.98%. Individual investors collectively hold 31.66% of the shares. Notably, there are no mutual funds or foreign institutional investors (FIIs) involved in the shareholding.

View full answer

What is the technical trend for Garnet Construct?

09-Jun-2025

As of May 12, 2025, Garnet Construct's technical trend is mildly bearish, influenced by mixed signals from MACD and moving averages, with weekly indicators showing a mildly bullish stance while monthly indicators lean bearish.

As of 12 May 2025, the technical trend for Garnet Construct has changed from bearish to mildly bearish. The weekly MACD indicates a mildly bullish stance, while the monthly MACD shows a mildly bearish trend. The RSI is bearish on the weekly timeframe, with no signal on the monthly. Bollinger Bands are bullish weekly but mildly bearish monthly. Daily moving averages are mildly bearish, and KST reflects a mildly bullish trend weekly and mildly bearish monthly. Dow Theory supports a mildly bullish outlook on both weekly and monthly timeframes. Overall, the current technical stance is mildly bearish, driven primarily by the mixed signals from MACD and moving averages.

View full answer

Has Garnet Construct declared dividend?

06-Jun-2025

No Dividend History Available

iScoreScore
Click here to find our call on this stock
Strong Sell
Sell
Hold
Buy
Strong Buy

Dashboard

1

With a Operating Losses, the company has a Weak Long Term Fundamental Strength

  • Poor long term growth as Net Sales has grown by an annual rate of 11.82% over the last 5 years
  • PAT(Latest six months) At Rs 3.68 cr has Grown at -81.32%
  • NET SALES(Latest six months) At Rs 10.27 cr has Grown at -74.09%
  • PBDIT(Q) Lowest at Rs -0.74 cr.
stock-summaryMojo Parameters

Mojo Parameters

Loading Valuation Snapshot...

Stock DNA

stock-summary
Industry

Realty

stock-summary
Market cap

INR 79 Cr (Micro Cap)

stock-summary
P/E

4.00

stock-summary
Industry P/E

36

stock-summary
Dividend Yield

0.00%

stock-summary
Debt Equity

0.06

stock-summary
Return on Equity

14.20%

stock-summary
Price to Book

0.53

Revenue and Profits:
Net Sales:
0 Cr
(Quarterly Results - Jun 2026)
Net Profit:
-1 Cr
stock-summaryTotal Returns
Total Returns (Price + Dividend) stock-summary
Dividend Yield (0%)
TimePeriod
Price Return
Dividend Return
Total Return
3 Months
-30.48%
0%
-30.48%
6 Months
-33.46%
0%
-33.46%
1 Year
26.01%
0%
26.01%
2 Years
16.36%
0%
16.36%
3 Years
202.07%
0%
202.07%
4 Years
165.59%
0%
165.59%
5 Years
141.4%
0%
141.4%

Garnet Construct for the last several years.

Risk Adjusted Returns v/s stock-summary
Returns Beta
Icon
Beta has not been calculated since enough price history is not available
stock-summaryNews & Corporate Actions

News

Garnet Construction Declines 8.00%: Financial Struggles and Downgrade Shape the Week

Announcements stock-summary

Results : Financial Statement For The Quarter Ended 30Th June 2026

14-Aug-2026 | Source : BSE

Unaudited Financial Results for the quarter ended 30th June 2026 have been approved and taken on record by the Board

Board Meeting Outcome for Unaudited Results Of The Company For The Quarter Ended 30Th June 2026

14-Aug-2026 | Source : BSE

The board and approved and taken on record the unaudited financial results for the quarter ended 30th June 2026

Board Meeting Intimation for Board Meeting Intimation For 14Th August 2026 To Consider The Unaudited Standalone Financial Results For The Quarter Ended 30Th June 2026

05-Aug-2026 | Source : BSE

Garnet Construction Ltdhas informed BSE that the meeting of the Board of Directors of the Company is scheduled on 14/08/2026 inter alia to consider and approve the unaudited standalone financial results for the quarter ended 30th June 2026

Corporate Actions stock-summary

stock-summary
BOARD MEETING

No Upcoming Board Meetings

stock-summary
DIVIDEND

No Dividend history available

stock-summary
SPLITS

No Splits history available

stock-summary
BONUS

No Bonus history available

stock-summary
RIGHTS

No Rights history available

stock-summaryKey Factors

Quality key factors stock-summary

Factor
Value
Sales Growth (5y)
11.82%
EBIT Growth (5y)
29.48%
EBIT to Interest (avg)
10.13
Debt to EBITDA (avg)
Negative Net Debt
Net Debt to Equity (avg)
0.06
Sales to Capital Employed (avg)
0.31
Tax Ratio
25.29%
Dividend Payout Ratio
0
Pledged Shares
0
Institutional Holding
0
ROCE (avg)
11.59%
ROE (avg)
8.23%

Valuation key factors

Factor
Value
P/E Ratio
4
Industry P/E
36
Price to Book Value
0.53
EV to EBIT
3.39
EV to EBITDA
3.32
EV to Capital Employed
0.56
EV to Sales
1.99
PEG Ratio
0.37
Dividend Yield
NA
ROCE (Latest)
33.42%
ROE (Latest)
14.20%

Technicals key factors

Indicator
Weekly
Monthly
MACD
Bearish
Mildly Bearish
RSI
Bullish
No Signal
Bollinger Bands
Mildly Bearish
Mildly Bearish
Moving Averages
Bearish (Daily)
KST
Bearish
Bullish
Dow Theory
Mildly Bullish
No Trend
stock-summary Technical Indicator Scale: Bearish, Mildly Bearish, Sideways, Mildly Bullish, Bullish  Turned 
stock-summaryShareholding
Shareholding Snapshot : Jun 2026stock-summary
Shareholding Compare (%holding) stock-summary
Majority shareholders

Promoters

Pledged Promoter Holdings

None

Mutual Funds

Held by 0 Schemes

FIIs

Held by 0 FIIs

Promoter with highest holding

Sanjay Kumar Kedia (45.34%)

Highest Public shareholder

Garnet Capital Finance Ltd (2.98%)

Individual Investors Holdings

32.25%

stock-summaryFinancial
[
  {
    "link": "quarterly",
    "btn_text": "All Quarterly Results",
    "header": "Quarterly Results Snapshot (Standalone) - Jun'26 - QoQ",
    "rhs": [
      {
        "prefix": "Net Sales ",
        "suffix": "QoQ Growth in quarter ended Jun 2026 is -101.25% vs -33.97% in Mar 2026",
        "dir": -1
      },
      {
        "prefix": "Standalone Net Profit ",
        "suffix": "QoQ Growth in quarter ended Jun 2026 is -122.03% vs -52.85% in Mar 2026",
        "dir": -1
      }
    ],
    "table": {
      "header": [
        "Jun'26",
        "Mar'26",
        "Change(%)"
      ],
      "body": [
        {
          "field": "Net Sales",
          "val1": "-0.13",
          "val2": "10.40",
          "chgp": "-101.25%",
          "chgp_class": "negative"
        },
        {
          "field": "Operating Profit (PBDIT) excl Other Income",
          "val1": "-0.74",
          "val2": "3.40",
          "chgp": "-121.76%",
          "chgp_class": "negative"
        },
        {
          "field": "Interest",
          "val1": "0.18",
          "val2": "0.17",
          "chgp": "5.88%",
          "chgp_class": "negative"
        },
        {
          "field": "Exceptional Items",
          "val1": "0.00",
          "val2": "0.00",
          "chgp": "",
          "chgp_class": "neutral"
        },
        {
          "field": "Standalone Net Profit",
          "val1": "-1.04",
          "val2": "4.72",
          "chgp": "-122.03%",
          "chgp_class": "negative"
        },
        {
          "field": "Operating Profit Margin (Excl OI)",
          "val1": "569.23%",
          "val2": "32.69%",
          "chgp": "536.54%",
          "chgp_class": "positive"
        }
      ]
    }
  },
  {
    "link": "half-yearly",
    "btn_text": "All Half Yearly Results",
    "header": "Half Yearly Results Snapshot (Standalone) - Sep'25",
    "rhs": [
      {
        "prefix": "Net Sales ",
        "suffix": " Growth in half year ended Sep 2025 is 254.85% vs 971.81% in Sep 2024",
        "dir": -1
      },
      {
        "prefix": "Standalone Net Profit ",
        "suffix": " Growth in half year ended Sep 2025 is 288.38% vs 138.58% in Sep 2024",
        "dir": 1
      }
    ],
    "table": {
      "header": [
        "Sep'25",
        "Sep'24",
        "Change(%)"
      ],
      "body": [
        {
          "field": "Net Sales",
          "val1": "56.67",
          "val2": "15.97",
          "chgp": "254.85%",
          "chgp_class": "positive"
        },
        {
          "field": "Operating Profit (PBDIT) excl Other Income",
          "val1": "33.58",
          "val2": "9.40",
          "chgp": "257.23%",
          "chgp_class": "positive"
        },
        {
          "field": "Interest",
          "val1": "0.33",
          "val2": "0.40",
          "chgp": "-17.50%",
          "chgp_class": "positive"
        },
        {
          "field": "Exceptional Items",
          "val1": "0.00",
          "val2": "0.00",
          "chgp": "",
          "chgp_class": "neutral"
        },
        {
          "field": "Standalone Net Profit",
          "val1": "24.74",
          "val2": "6.37",
          "chgp": "288.38%",
          "chgp_class": "positive"
        },
        {
          "field": "Operating Profit Margin (Excl OI)",
          "val1": "59.26%",
          "val2": "58.86%",
          "chgp": "0.40%",
          "chgp_class": "positive"
        }
      ]
    }
  },
  {
    "link": "nine-monthly",
    "btn_text": "All Nine Monthly Results",
    "header": "Nine Monthly Results Snapshot (Standalone) - Dec'25",
    "rhs": [
      {
        "prefix": "Net Sales ",
        "suffix": "YoY Growth in nine months ended Dec 2025 is 330.05% vs 537.88% in Dec 2024",
        "dir": -1
      },
      {
        "prefix": "Standalone Net Profit ",
        "suffix": "YoY Growth in nine months ended Dec 2025 is 487.99% vs -1.66% in Dec 2024",
        "dir": 1
      }
    ],
    "table": {
      "header": [
        "Dec'25",
        "Dec'24",
        "Change(%)"
      ],
      "body": [
        {
          "field": "Net Sales",
          "val1": "72.42",
          "val2": "16.84",
          "chgp": "330.05%",
          "chgp_class": "positive"
        },
        {
          "field": "Operating Profit (PBDIT) excl Other Income",
          "val1": "47.36",
          "val2": "9.18",
          "chgp": "415.90%",
          "chgp_class": "positive"
        },
        {
          "field": "Interest",
          "val1": "0.76",
          "val2": "0.58",
          "chgp": "31.03%",
          "chgp_class": "negative"
        },
        {
          "field": "Exceptional Items",
          "val1": "0.00",
          "val2": "0.00",
          "chgp": "",
          "chgp_class": "neutral"
        },
        {
          "field": "Standalone Net Profit",
          "val1": "34.75",
          "val2": "5.91",
          "chgp": "487.99%",
          "chgp_class": "positive"
        },
        {
          "field": "Operating Profit Margin (Excl OI)",
          "val1": "65.40%",
          "val2": "54.51%",
          "chgp": "10.89%",
          "chgp_class": "positive"
        }
      ]
    }
  },
  {
    "link": "annual",
    "btn_text": "All Annual Results",
    "header": "Annual Results Snapshot (Standalone) - Mar'26",
    "rhs": [
      {
        "prefix": "Net Sales ",
        "suffix": "YoY Growth in year ended Mar 2026 is 414.73% vs 44.56% in Mar 2025",
        "dir": 1
      },
      {
        "prefix": "Standalone Net Profit ",
        "suffix": "YoY Growth in year ended Mar 2026 is 432.79% vs 152.04% in Mar 2025",
        "dir": 1
      }
    ],
    "table": {
      "header": [
        "Mar'26",
        "Mar'25",
        "Change(%)"
      ],
      "body": [
        {
          "field": "Net Sales",
          "val1": "82.82",
          "val2": "16.09",
          "chgp": "414.73%",
          "chgp_class": "positive"
        },
        {
          "field": "Operating Profit (PBDIT) excl Other Income",
          "val1": "50.76",
          "val2": "7.82",
          "chgp": "549.10%",
          "chgp_class": "positive"
        },
        {
          "field": "Interest",
          "val1": "0.93",
          "val2": "0.93",
          "chgp": "",
          "chgp_class": "neutral"
        },
        {
          "field": "Exceptional Items",
          "val1": "0.00",
          "val2": "0.00",
          "chgp": "",
          "chgp_class": "neutral"
        },
        {
          "field": "Standalone Net Profit",
          "val1": "39.48",
          "val2": "7.41",
          "chgp": "432.79%",
          "chgp_class": "positive"
        },
        {
          "field": "Operating Profit Margin (Excl OI)",
          "val1": "61.29%",
          "val2": "48.60%",
          "chgp": "12.69%",
          "chgp_class": "positive"
        }
      ]
    }
  }
]

Quarterly Results Snapshot (Standalone) - Jun'26 - QoQstock-summary

Jun'26
Mar'26
Change(%)
Net Sales
-0.13
10.40
-101.25%
Operating Profit (PBDIT) excl Other Income
-0.74
3.40
-121.76%
Interest
0.18
0.17
5.88%
Exceptional Items
0.00
0.00
Standalone Net Profit
-1.04
4.72
-122.03%
Operating Profit Margin (Excl OI)
569.23%
32.69%
536.54%
Values in Rs Cr.
Direction Arrows
Net Sales

QoQ Growth in quarter ended Jun 2026 is -101.25% vs -33.97% in Mar 2026

Direction Arrows
Standalone Net Profit

QoQ Growth in quarter ended Jun 2026 is -122.03% vs -52.85% in Mar 2026

Half Yearly Results Snapshot (Standalone) - Sep'25stock-summary

Sep'25
Sep'24
Change(%)
Net Sales
56.67
15.97
254.85%
Operating Profit (PBDIT) excl Other Income
33.58
9.40
257.23%
Interest
0.33
0.40
-17.50%
Exceptional Items
0.00
0.00
Standalone Net Profit
24.74
6.37
288.38%
Operating Profit Margin (Excl OI)
59.26%
58.86%
0.40%
Values in Rs Cr.
Direction Arrows
Net Sales

Growth in half year ended Sep 2025 is 254.85% vs 971.81% in Sep 2024

Direction Arrows
Standalone Net Profit

Growth in half year ended Sep 2025 is 288.38% vs 138.58% in Sep 2024

Nine Monthly Results Snapshot (Standalone) - Dec'25stock-summary

Dec'25
Dec'24
Change(%)
Net Sales
72.42
16.84
330.05%
Operating Profit (PBDIT) excl Other Income
47.36
9.18
415.90%
Interest
0.76
0.58
31.03%
Exceptional Items
0.00
0.00
Standalone Net Profit
34.75
5.91
487.99%
Operating Profit Margin (Excl OI)
65.40%
54.51%
10.89%
Values in Rs Cr.
Direction Arrows
Net Sales

YoY Growth in nine months ended Dec 2025 is 330.05% vs 537.88% in Dec 2024

Direction Arrows
Standalone Net Profit

YoY Growth in nine months ended Dec 2025 is 487.99% vs -1.66% in Dec 2024

Annual Results Snapshot (Standalone) - Mar'26stock-summary

Mar'26
Mar'25
Change(%)
Net Sales
82.82
16.09
414.73%
Operating Profit (PBDIT) excl Other Income
50.76
7.82
549.10%
Interest
0.93
0.93
Exceptional Items
0.00
0.00
Standalone Net Profit
39.48
7.41
432.79%
Operating Profit Margin (Excl OI)
61.29%
48.60%
12.69%
Values in Rs Cr.
Direction Arrows
Net Sales

YoY Growth in year ended Mar 2026 is 414.73% vs 44.56% in Mar 2025

Direction Arrows
Standalone Net Profit

YoY Growth in year ended Mar 2026 is 432.79% vs 152.04% in Mar 2025

stock-summaryCompany CV
About Garnet Construction Ltd stock-summary
stock-summary
Garnet Construction Ltd
Micro Cap
Realty
Garnet Construction Limited was incorporated on October 15, 1992 in Mumbai as a Public Limited Company and thereafter listed with National Stock Exchange and Bombay Stock Exchange on December 15, 1994. Garnet began its business in 1995, with a simple but bold philosophy set by its founder, Mr. Kishan Kumar Kedia. While others relied on speculation and borrowed funds, Company took the harder route; self-funding every project, ensuring that each acre developed was free of financial uncertainty.
Company Coordinates stock-summary
Company Details
501/531 Laxmi Mall New Link Rd, Laxmi Indl Estate Andheri (W) Mumbai Maharashtra : 400053
stock-summary
Tel: 91-22-42578500
stock-summary
garnet@garnetconstructions.com
Registrar Details
Link Intime India Pvt Ltd, C-13 Pannalal Silk Compound, L B S Marg, Bhandup , Mumbai