
Compare Garnet Construct with Similar Stocks
Dashboard
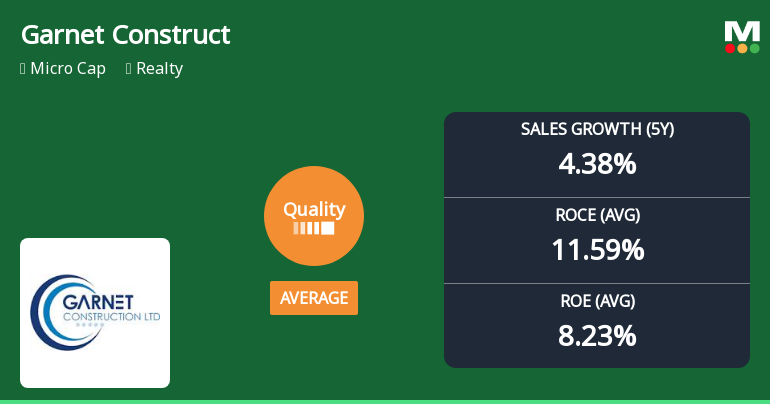
Poor Management Efficiency with a low ROE of 8.23%
- The company has been able to generate a Return on Equity (avg) of 8.23% signifying low profitability per unit of shareholders funds
Company has a Debt to Equity ratio (avg) of 0.09 times
Poor long term growth as Net Sales has grown by an annual rate of 4.38% over the last 5 years
The company has declared Positive results for the last 4 consecutive quarters
With ROE of 27.7, it has a Very Attractive valuation with a 0.7 Price to Book Value
Majority shareholders : Promoters
Consistent Returns over the last 3 years
Total Returns (Price + Dividend) 
Garnet Construct for the last several years.
Risk Adjusted Returns v/s
Returns Beta

News
Garnet Construction Ltd Quality Grade Downgrade: An In-Depth Analysis of Business Fundamentals
Garnet Construction Ltd, a micro-cap player in the Realty sector, has seen its quality grade downgraded from Buy to Hold by MarketsMOJO as of 17 Nov 2025, reflecting a shift from below average to average in its business fundamentals. Despite impressive long-term stock returns, the company’s financial metrics reveal a nuanced picture of improvement in some areas and deterioration in others, prompting a reassessment of its investment appeal.
Read full news article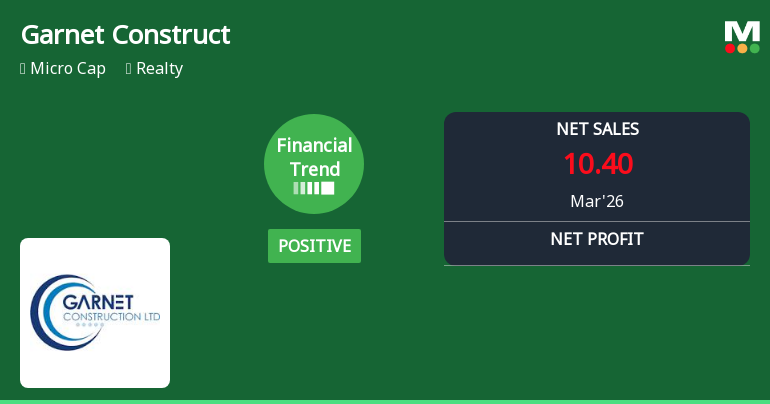
Garnet Construction Ltd Reports Mixed Quarterly Results Amid Shifting Financial Trends
Garnet Construction Ltd, a micro-cap player in the Realty sector, has posted a mixed set of quarterly results for March 2026, reflecting a shift from a very positive to a positive financial trend. While net sales and profit after tax (PAT) have shown remarkable growth over the last six months, key profitability metrics for the quarter have contracted compared to previous periods, prompting a downgrade in its Mojo Grade from Buy to Hold.
Read full news article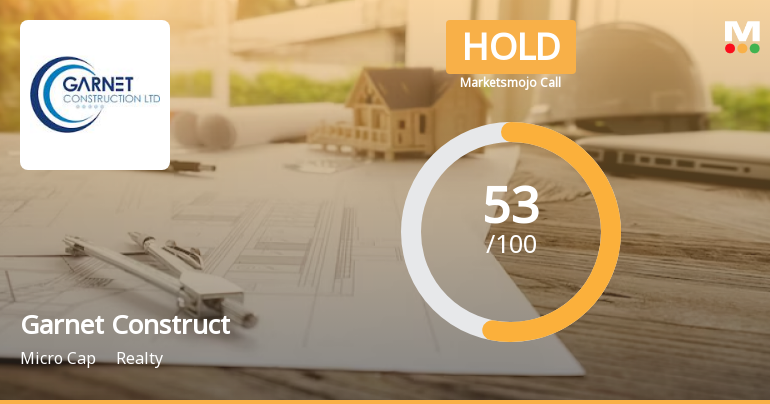
Garnet Construction Ltd is Rated Hold by MarketsMOJO
Garnet Construction Ltd is rated Hold by MarketsMOJO, with this rating last updated on 17 Nov 2025. However, the analysis and financial metrics discussed below reflect the company’s current position as of 01 June 2026, providing investors with an up-to-date view of the stock’s fundamentals, valuation, financial trends, and technical outlook.
Read full news article Announcements
Financials Results For The Year Ended 31St March 2026
30-May-2026 | Source : BSEThe board of directors of the company has duly approved and taken on record the audited financial result of the company for the year ended 31st March 2026.
Board Meeting Outcome for Financial Results For The Quarter And Year Ended 31St March2026
30-May-2026 | Source : BSEThe board of Directors of the company have duly approved and taken on records the audited financial results for the quarter and year ended 31st March 2026
Compliances-Reg.24(A)-Annual Secretarial Compliance
30-May-2026 | Source : BSEAs per regulation 24A of the SEBI (LODR) Regulation 2015 annual secretarial compliance report for the FY 2025-26 has be uploaded.
Corporate Actions

No Upcoming Board Meetings

No Dividend history available

No Splits history available

No Bonus history available

No Rights history available
Quality key factors
Valuation key factors
Technicals key factors
 Technical Indicator Scale: Bearish, Mildly Bearish, Sideways, Mildly Bullish, Bullish Turned
 Shareholding Snapshot : Mar 2026
Shareholding Compare (%holding)
Promoters
None
Held by 0 Schemes
Held by 0 FIIs
Kishan Kumar J Kedia (29.37%)
Garnet Capital Finance Ltd (2.98%)
32.14%
Quarterly Results Snapshot (Standalone) - Mar'26 - QoQ

QoQ Growth in quarter ended Mar 2026 is -33.97% vs -3.31% in Dec 2025
QoQ Growth in quarter ended Mar 2026 is -52.85% vs 53.29% in Dec 2025
Half Yearly Results Snapshot (Standalone) - Sep'25
Growth in half year ended Sep 2025 is 254.85% vs 971.81% in Sep 2024

Growth in half year ended Sep 2025 is 288.38% vs 138.58% in Sep 2024
Nine Monthly Results Snapshot (Standalone) - Dec'25
YoY Growth in nine months ended Dec 2025 is 330.05% vs 537.88% in Dec 2024
YoY Growth in nine months ended Dec 2025 is 487.99% vs -1.66% in Dec 2024
Annual Results Snapshot (Standalone) - Mar'26
YoY Growth in year ended Mar 2026 is 414.73% vs 44.56% in Mar 2025
YoY Growth in year ended Mar 2026 is 432.79% vs 152.04% in Mar 2025
About Garnet Construction Ltd

Company Coordinates


