
Compare Garuda Cons with Similar Stocks
Dashboard
The company is Net-Debt Free
Healthy long term growth as Net Sales has grown by an annual rate of 48.90% and Operating profit at 43.71%
With a growth in Net Sales of 6.43%, the company declared Very Positive results in Mar 26
With ROE of 27, it has a Expensive valuation with a 3.6 Price to Book Value
Despite the size of the company, domestic mutual funds hold only 1.31% of the company
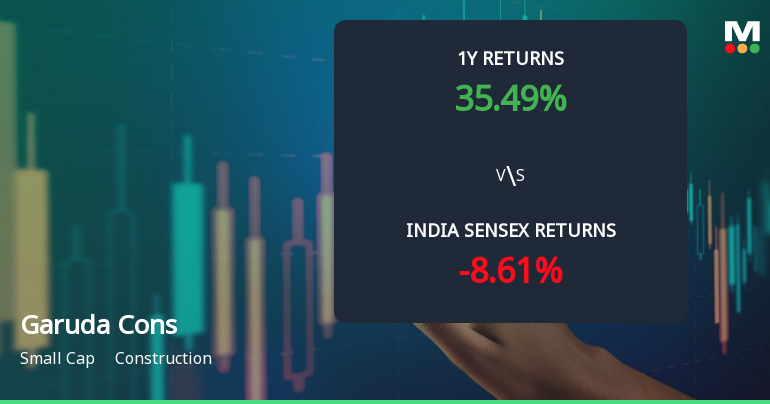
Market Beating Performance
Stock DNA
Construction
INR 1,635 Cr (Small Cap)
13.00
36
0.00%
-0.02
26.97%
3.56
Total Returns (Price + Dividend) 
Latest dividend: 0 per share ex-dividend date: Feb-17-2025
Risk Adjusted Returns v/s
Returns Beta

News
Garuda Construction and Engineering Ltd: Technical Momentum Shifts Amid Mixed Market Signals
Garuda Construction and Engineering Ltd has experienced a notable shift in its technical momentum, moving from a sideways trend to a mildly bearish stance. Despite a recent downgrade in daily moving averages and a 3.29% drop in share price, several weekly indicators suggest a complex interplay of bullish and bearish signals, reflecting a nuanced outlook for this small-cap construction stock.
Read full news article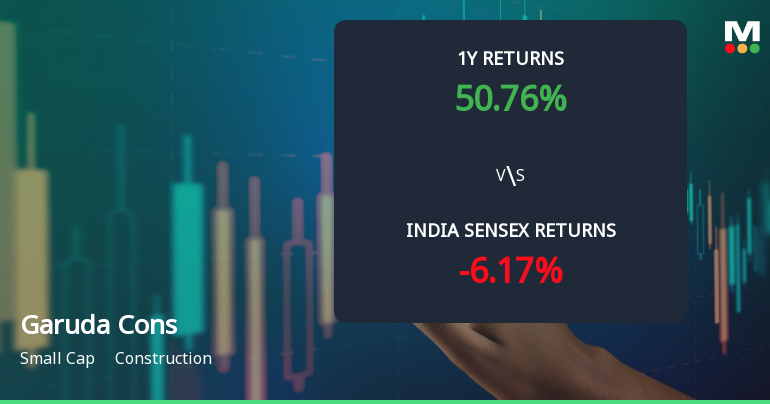
Garuda Construction and Engineering Ltd Sees Technical Momentum Shift Amid Sideways Trend
Garuda Construction and Engineering Ltd has experienced a notable shift in its technical momentum, moving from a mildly bearish stance to a more sideways trend, reflecting a complex interplay of bullish and bearish signals across key indicators. The stock’s recent 2.72% gain to ₹183.10, coupled with a revised Mojo Grade upgrade from Sell to Hold, signals cautious optimism amid a volatile construction sector backdrop.
Read full news article
Garuda Construction and Engineering Ltd Faces Mildly Bearish Technical Shift Amid Mixed Momentum
Garuda Construction and Engineering Ltd has experienced a subtle but notable shift in its technical parameters, moving from a mildly bullish to a mildly bearish trend. Despite a strong one-year return of 47.3%, recent technical indicators suggest caution for investors as momentum indicators and moving averages signal a potential slowdown in price appreciation.
Read full news article Announcements
Corporate Actions

No Upcoming Board Meetings


No Splits history available

No Bonus history available

No Rights history available
Quality key factors
Valuation key factors
Technicals key factors
 Technical Indicator Scale: Bearish, Mildly Bearish, Sideways, Mildly Bullish, Bullish Turned
 Shareholding Snapshot : Mar 2026
Shareholding Compare (%holding)
Promoters
None
Held by 1 Schemes (0.42%)
Held by 10 FIIs (2.64%)
Pkh Ventures Limited (51.7%)
Yash Shares And Stock Private Limited (3.98%)
20.96%
Quarterly Results Snapshot (Standalone) - Mar'26 - QoQ

QoQ Growth in quarter ended Mar 2026 is 6.43% vs 20.26% in Dec 2025
QoQ Growth in quarter ended Mar 2026 is 4.40% vs 21.48% in Dec 2025
Half Yearly Results Snapshot (Standalone) - Sep'25

Growth in half year ended Sep 2025 is 195.08% vs 124.82% in Sep 2024
Growth in half year ended Sep 2025 is 191.95% vs 113.45% in Sep 2024
Nine Monthly Results Snapshot (Standalone) - Dec'25
YoY Growth in nine months ended Dec 2025 is 164.86% vs 53.43% in Dec 2024
YoY Growth in nine months ended Dec 2025 is 177.46% vs 39.97% in Dec 2024
Annual Results Snapshot (Standalone) - Mar'26
YoY Growth in year ended Mar 2026 is 135.84% vs 45.95% in Mar 2025
YoY Growth in year ended Mar 2026 is 146.06% vs 36.66% in Mar 2025
About Garuda Construction and Engineering Ltd

Company Coordinates


