
Compare Garware Hi Tech with Similar Stocks
Dashboard
The company is Net-Debt Free
Poor long term growth as Operating profit has grown by an annual rate 14.96% of over the last 5 years
With ROE of 12.7, it has a Very Expensive valuation with a 5.9 Price to Book Value
Majority shareholders : Promoters
Consistent Returns over the last 3 years
With its market cap of Rs 15,333 cr, it is the biggest company in the sector and constitutes 47.05% of the entire sector
Stock DNA
Plastic Products - Industrial
INR 15,766 Cr (Small Cap)
46.00
19
0.18%
-0.29
12.73%
5.77
Total Returns (Price + Dividend) 
Latest dividend: 12 per share ex-dividend date: Sep-17-2025
Risk Adjusted Returns v/s
Returns Beta

News
Garware Hi Tech Films Ltd is Rated Hold
Garware Hi Tech Films Ltd is rated 'Hold' by MarketsMOJO, with this rating last updated on 04 May 2026. However, the analysis and financial metrics presented here reflect the stock’s current position as of 19 June 2026, providing investors with the latest insights into the company’s performance and outlook.
Read full news article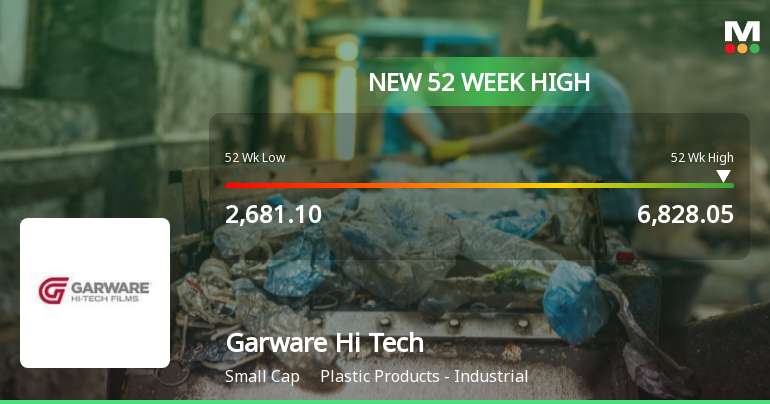
Broad-Based Technical Strength Lifts Garware Hi Tech Films Ltd to 52-Week High of Rs 6814
Surging to an all-time high of Rs 6814 on 19 Jun 2026, Garware Hi Tech Films Ltd has demonstrated remarkable price momentum, outperforming its sector and the broader market with a 66.52% gain over the past year against the Sensex’s decline of 5.76%.
Read full news article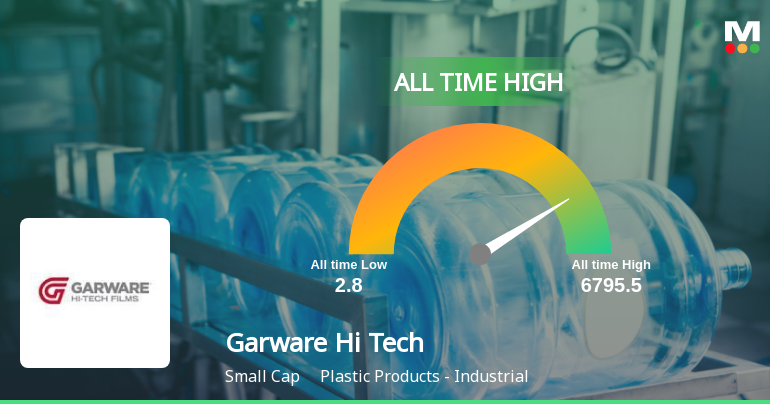
Announcements
Intimation Under Regulation 30 Of SEBI (LODR) Regulations 2015
16-Jun-2026 | Source : BSEIntimation under Regulation 30 of SEBI (LODR) Regulations 2015.
Announcement under Regulation 30 (LODR)-Analyst / Investor Meet - Intimation
09-Jun-2026 | Source : BSEIntimation under Regulation 30 of SEBI (LODR) Regulations 2015 about Schedule of meet
Announcement under Regulation 30 (LODR)-Newspaper Publication
23-May-2026 | Source : BSECopy of Newspaper Publication regarding the information of Postal Ballot Notice including remote e-voting process.
Corporate Actions

No Upcoming Board Meetings

Garware Hi Tech Films Ltd has declared 120% dividend, ex-date: 17 Sep 25

No Splits history available

No Bonus history available

No Rights history available
Quality key factors
Valuation key factors
Technicals key factors
 Technical Indicator Scale: Bearish, Mildly Bearish, Sideways, Mildly Bullish, Bullish Turned
 Shareholding Snapshot : Mar 2026
Shareholding Compare (%holding)
Promoters
None
Held by 16 Schemes (4.46%)
Held by 98 FIIs (3.98%)
Shashikant Bhalchandra Garware (38.17%)
Lic Mf Multi Cap Fund (2.28%)
21.41%
Quarterly Results Snapshot (Consolidated) - Mar'26 - QoQ

QoQ Growth in quarter ended Mar 2026 is 30.07% vs -19.48% in Dec 2025
QoQ Growth in quarter ended Mar 2026 is 94.03% vs -38.87% in Dec 2025
Half Yearly Results Snapshot (Consolidated) - Sep'25

Growth in half year ended Sep 2025 is -2.77% vs 40.97% in Sep 2024
Growth in half year ended Sep 2025 is -9.53% vs 114.97% in Sep 2024
Nine Monthly Results Snapshot (Consolidated) - Dec'25
YoY Growth in nine months ended Dec 2025 is -2.43% vs 26.90% in Dec 2024
YoY Growth in nine months ended Dec 2025 is -9.23% vs 74.20% in Dec 2024
Annual Results Snapshot (Consolidated) - Mar'26
YoY Growth in year ended Mar 2026 is 0.51% vs 25.78% in Mar 2025
YoY Growth in year ended Mar 2026 is 2.12% vs 62.93% in Mar 2025
About Garware Hi Tech Films Ltd

Company Coordinates


