
Compare Garware Hi Tech with Similar Stocks
Dashboard
The company is Net-Debt Free
Poor long term growth as Operating profit has grown by an annual rate 14.96% of over the last 5 years
With ROE of 12.7, it has a Very Expensive valuation with a 5.4 Price to Book Value
Majority shareholders : Promoters
Consistent Returns over the last 3 years
With its market cap of Rs 14,338 cr, it is the biggest company in the sector and constitutes 47.36% of the entire sector
Stock DNA
Plastic Products - Industrial
INR 14,505 Cr (Small Cap)
42.00
18
0.19%
-0.29
12.73%
5.40
Total Returns (Price + Dividend) 
Latest dividend: 12 per share ex-dividend date: Sep-17-2025
Risk Adjusted Returns v/s
Returns Beta

News
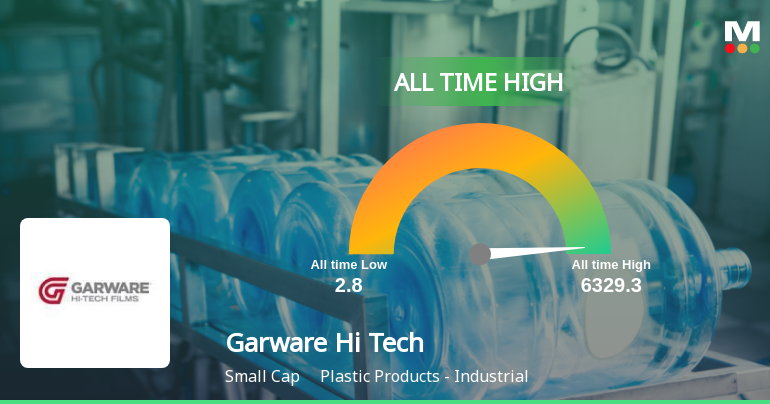
Garware Hi Tech Films Ltd Hits All-Time High of Rs 6,329.3 as Momentum Builds Across Timeframes
Extending its remarkable rally, Garware Hi Tech Films Ltd touched a fresh all-time high of Rs 6,329.3 on 10 Jun 2026, underscoring a sustained momentum that has outpaced the broader market by a wide margin over multiple timeframes.
Read full news article
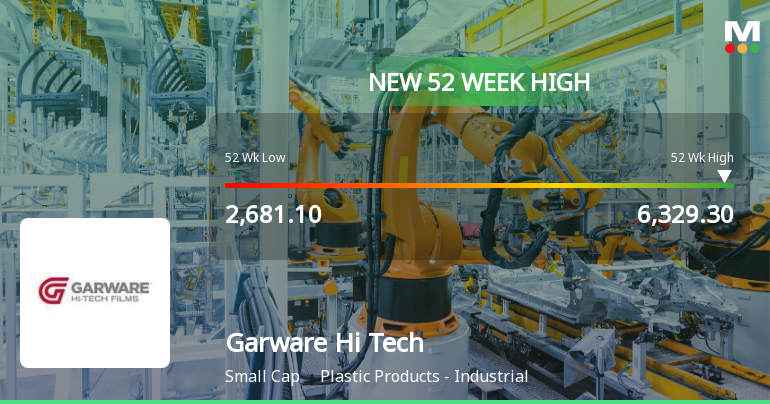
Broad-Based Technical Strength Lifts Garware Hi Tech Films Ltd to 52-Week High of Rs 6270.65
Surging past its previous peaks, Garware Hi Tech Films Ltd touched a new 52-week high of Rs 6270.65 on 09 Jun 2026, marking a remarkable 38.27% gain over the past year against the Sensex’s decline of 10.34%. This milestone underscores the stock’s robust price momentum amid a mixed broader market backdrop.
Read full news article Announcements
Announcement under Regulation 30 (LODR)-Analyst / Investor Meet - Intimation
09-Jun-2026 | Source : BSEIntimation under Regulation 30 of SEBI (LODR) Regulations 2015 about Schedule of meet
Announcement under Regulation 30 (LODR)-Newspaper Publication
23-May-2026 | Source : BSECopy of Newspaper Publication regarding the information of Postal Ballot Notice including remote e-voting process.
Shareholder Meeting / Postal Ballot-Notice of Postal Ballot
22-May-2026 | Source : BSENotice of Postal Ballot
Corporate Actions

No Upcoming Board Meetings

Garware Hi Tech Films Ltd has declared 120% dividend, ex-date: 17 Sep 25

No Splits history available

No Bonus history available

No Rights history available
Quality key factors
Valuation key factors
Technicals key factors
 Technical Indicator Scale: Bearish, Mildly Bearish, Sideways, Mildly Bullish, Bullish Turned
 Shareholding Snapshot : Mar 2026
Shareholding Compare (%holding)
Promoters
None
Held by 16 Schemes (4.46%)
Held by 98 FIIs (3.98%)
Shashikant Bhalchandra Garware (38.17%)
Lic Mf Multi Cap Fund (2.28%)
21.41%
Quarterly Results Snapshot (Consolidated) - Mar'26 - QoQ

QoQ Growth in quarter ended Mar 2026 is 30.07% vs -19.48% in Dec 2025
QoQ Growth in quarter ended Mar 2026 is 94.03% vs -38.87% in Dec 2025
Half Yearly Results Snapshot (Consolidated) - Sep'25

Growth in half year ended Sep 2025 is -2.77% vs 40.97% in Sep 2024
Growth in half year ended Sep 2025 is -9.53% vs 114.97% in Sep 2024
Nine Monthly Results Snapshot (Consolidated) - Dec'25
YoY Growth in nine months ended Dec 2025 is -2.43% vs 26.90% in Dec 2024
YoY Growth in nine months ended Dec 2025 is -9.23% vs 74.20% in Dec 2024
Annual Results Snapshot (Consolidated) - Mar'26
YoY Growth in year ended Mar 2026 is 0.51% vs 25.78% in Mar 2025
YoY Growth in year ended Mar 2026 is 2.12% vs 62.93% in Mar 2025
About Garware Hi Tech Films Ltd

Company Coordinates


