
Compare Garware Synth with Similar Stocks
Dashboard
With a Negative Book Value, the company has a Weak Long Term Fundamental Strength
- Poor long term growth as Net Sales has grown by an annual rate of 4.59% and Operating profit at 0% over the last 5 years
- The company has a negative book value of Rs 1.53 crore
Flat results in Mar 26
Risky - Negative Book Value
Underperformed the market in the last 1 year
Stock DNA
Trading & Distributors
INR 10 Cr (Micro Cap)
28.00
23
0.00%
-3.52
-24.18%
-6.67
Total Returns (Price + Dividend) 
Garware Synth for the last several years.
Risk Adjusted Returns v/s
Returns Beta

News
Are Garware Synthetics Ltd latest results good or bad?
Garware Synthetics Ltd's latest financial results for Q4 FY26 reflect significant challenges in its operational performance. The company reported a net loss of ₹0.09 crores, contrasting sharply with a profit of ₹0.22 crores in the previous quarter, indicating a notable decline in profitability. Revenue for the quarter stood at ₹2.41 crores, which represents a year-on-year decrease of 12.36% from ₹2.75 crores in Q4 FY25, highlighting ongoing difficulties in maintaining sales levels. The operating margin has also come under pressure, dropping to 1.66%, a significant reduction from 13.65% in Q3 FY26. This decline in operating profitability is attributed to rising employee costs and a contraction in gross profit margin, which fell to 0.83% from 12.85% in the previous quarter. The company’s balance sheet shows a negative book value of ₹1.97 crores, reflecting accumulated losses and raising concerns about its fi...
Read full news article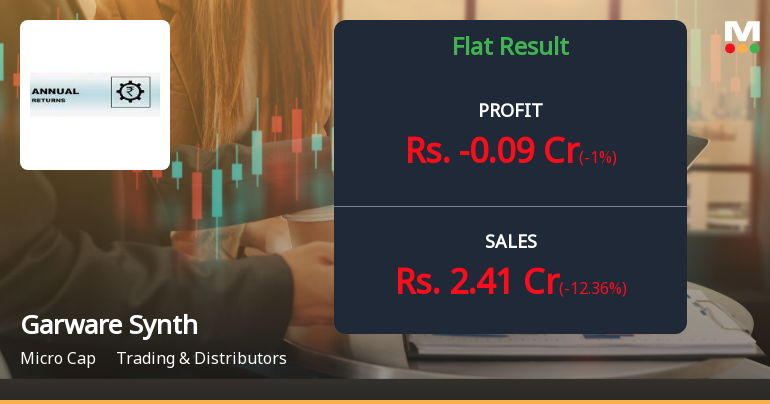
Garware Synthetics Q4 FY26: Losses Mount as Operational Struggles Persist
Garware Synthetics Ltd., a micro-cap manufacturer of nylon monofilaments and bristles, reported a disappointing Q4 FY26 with a net loss of ₹0.09 crores, marking a sharp reversal from the ₹0.22 crores profit recorded in Q3 FY26. The stock, currently trading at ₹20.00 with a market capitalisation of just ₹12.00 crores, has declined 2.44% following the results announcement, reflecting investor concerns over deteriorating profitability and persistent operational challenges.
Read full news article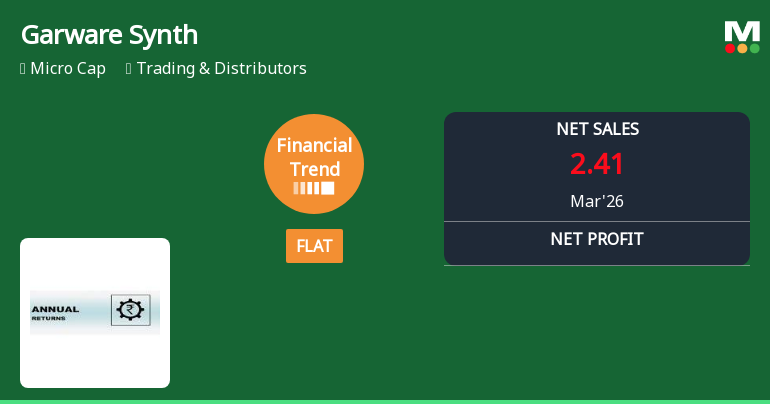
Garware Synthetics Ltd Reports Flat Quarterly Performance Amid Mixed Returns
Garware Synthetics Ltd, a micro-cap player in the Trading & Distributors sector, has reported a flat financial performance for the quarter ended March 2026, marking a notable shift from its previously positive growth trajectory. Despite a modest increase in profit after tax (PAT) over nine months, the company’s quarterly earnings per share (EPS) hit a low, reflecting ongoing challenges in margin expansion and revenue growth.
Read full news article Announcements
Announcement under Regulation 30 (LODR)-Newspaper Publication
01-Jun-2026 | Source : BSESubmission of Newspaper Clipping for Audited Financial Results.
Submission Of Revised Audited Financial Results For The Quarter And Year Ended 31.03.2026.
01-Jun-2026 | Source : BSESubmission of Revised Audited Financial Results for the Quarter and Year ended 31.03.2026.
Audited Financial Results For The Quarter And Year Ended 31.03.2026 .
30-May-2026 | Source : BSESubmission of Results for the Quarter and Year ended 31.03.2026.
Corporate Actions

No Upcoming Board Meetings

No Dividend history available

No Splits history available

No Bonus history available

No Rights history available
Quality key factors
Valuation key factors
Technicals key factors
 Technical Indicator Scale: Bearish, Mildly Bearish, Sideways, Mildly Bullish, Bullish Turned
 Shareholding Snapshot : Mar 2026
Shareholding Compare (%holding)
Non Institution
None
Held by 0 Schemes
Held by 0 FIIs
Nihal Chandrakant Garware (39.16%)
Niche Financial Services Pvt Ltd (3.85%)
42.6%
Quarterly Results Snapshot (Standalone) - Mar'26 - YoY

YoY Growth in quarter ended Mar 2026 is -12.36% vs 5.36% in Mar 2025
YoY Growth in quarter ended Mar 2026 is -1,000.00% vs -92.86% in Mar 2025
Half Yearly Results Snapshot (Standalone) - Sep'25

Growth in half year ended Sep 2025 is 96.39% vs -48.32% in Sep 2024
Growth in half year ended Sep 2025 is 700.00% vs 113.04% in Sep 2024
Nine Monthly Results Snapshot (Standalone) - Dec'25
YoY Growth in nine months ended Dec 2025 is 49.06% vs -34.16% in Dec 2024
YoY Growth in nine months ended Dec 2025 is 757.14% vs 65.00% in Dec 2024
Annual Results Snapshot (Standalone) - Mar'26
YoY Growth in year ended Mar 2026 is -3.63% vs 0.28% in Mar 2025
YoY Growth in year ended Mar 2026 is 3,500.00% vs 120.00% in Mar 2025
About Garware Synthetics Ltd

Company Coordinates


