
Compare Gatekeeper Systems, Inc. with Similar Stocks
Dashboard
With a fall in Net Sales of -4.69%, the company declared Very Negative results in May 25
- The company has declared negative results for the last 3 consecutive quarters
- The company has declared negative results in May 24 after 2 consecutive negative quarters
- NET PROFIT(HY) At CAD -1.36 MM has Grown at -223.68%
- INTEREST(HY) At CAD 0.11 MM has Grown at 81.61%
- PRE-TAX PROFIT(Q) At CAD -0.43 MM has Fallen at -947.56%
Risky -
Stock DNA
Telecom - Equipment & Accessories
CAD 200 Million (Small Cap)
NA (Loss Making)
NA
0.00%
-0.55
-12.06%
7.66
Total Returns (Price + Dividend) 
Gatekeeper Systems, Inc. for the last several years.
Risk Adjusted Returns v/s
News
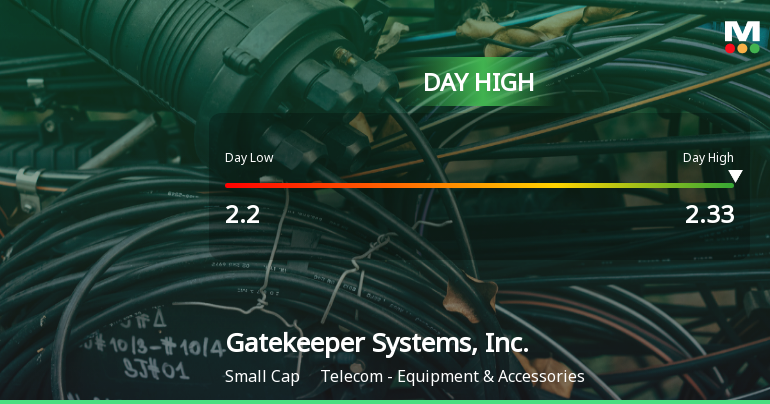
Gatekeeper Systems Hits Day High with Strong 8.37% Intraday Surge
Gatekeeper Systems, Inc. has seen a notable rise in its stock today, reaching an intraday high and outperforming the S&P/TSX 60. Despite a year-to-date performance significantly exceeding the index, the company has faced challenges with negative results over the last three quarters and declining profits.
Read full news article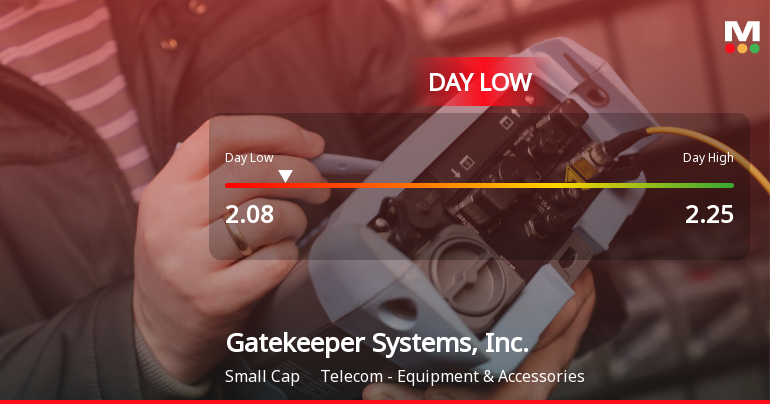
Gatekeeper Systems Hits Day Low of CAD 2.08 Amid Price Pressure
Gatekeeper Systems, Inc. faced notable stock volatility on November 6, 2025, with a significant decline. Over the past week and month, the stock has dropped considerably, contrasting with the S&P/TSX 60's performance. Despite a strong annual growth rate, the company has reported negative results for three consecutive quarters.
Read full news article Announcements

Corporate Actions
Quality key factors
Valuation key factors
Technicals key factors
 Technical Indicator Scale: Bearish, Mildly Bearish, Sideways, Mildly Bullish, Bullish Turned
 Shareholding Snapshot
Shareholding Compare (%holding)
Quarterly Results Snapshot (Consolidated) - May'25 - QoQ
Not Applicable: The company has declared_date for only one period
Not Applicable: The company has declared_date for only one period
Annual Results Snapshot (Consolidated) - Aug'24

YoY Growth in year ended Aug 2024 is 35.97% vs 39.00% in Aug 2023
YoY Growth in year ended Aug 2024 is -28.57% vs 47.37% in Aug 2023
About Gatekeeper Systems, Inc.

Company Coordinates


