
Compare Gateway Distri with Similar Stocks
Stock DNA
Transport Services
INR 2,878 Cr (Small Cap)
11.00
33
5.34%
0.23
11.26%
1.26
Total Returns (Price + Dividend) 
Latest dividend: 1.2 per share ex-dividend date: Feb-12-2026
Risk Adjusted Returns v/s
Returns Beta

News

Gateway Distriparks Ltd is Rated Sell
Gateway Distriparks Ltd is rated Sell by MarketsMOJO, with this rating last updated on 08 May 2026. However, the analysis and financial metrics discussed below reflect the stock’s current position as of 02 June 2026, providing investors with the latest insights into the company’s performance and outlook.
Read full news article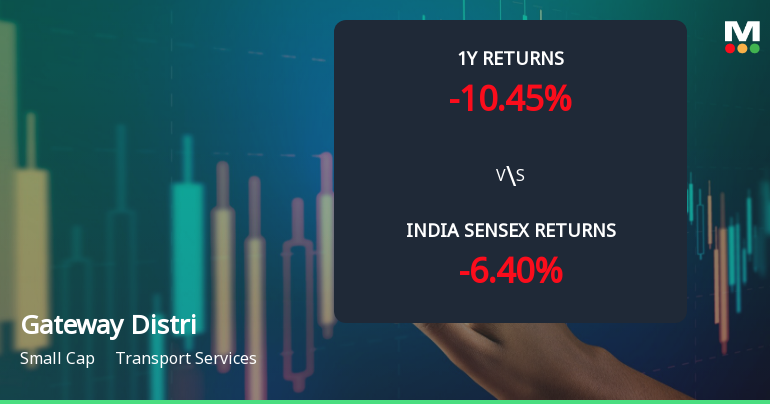
Gateway Distriparks Ltd Technical Momentum Shifts Amid Mixed Market Signals
Gateway Distriparks Ltd has experienced a subtle shift in its technical momentum, reflecting a complex interplay of bullish and bearish signals across multiple timeframes. Despite a modest day gain of 0.87%, the stock’s technical indicators reveal a nuanced picture that investors should carefully analyse amid its recent downgrade to a Sell rating by MarketsMOJO.
Read full news article
Gateway Distriparks Ltd is Rated Sell
Gateway Distriparks Ltd is rated 'Sell' by MarketsMOJO, with this rating last updated on 08 May 2026. However, the analysis and financial metrics discussed here reflect the stock's current position as of 22 May 2026, providing investors with an up-to-date view of the company’s fundamentals, returns, and market performance.
Read full news article Announcements
Announcement under Regulation 30 (LODR)-Newspaper Publication
02-Jun-2026 | Source : BSEAs attached.
Announcement under Regulation 30 (LODR)-Analyst / Investor Meet - Intimation
14-May-2026 | Source : BSEAs attached.
Announcement under Regulation 30 (LODR)-Earnings Call Transcript
13-May-2026 | Source : BSEAs attached.
Corporate Actions

No Upcoming Board Meetings

Gateway Distriparks Ltd has declared 7% dividend, ex-date: 12 Feb 26

No Splits history available

No Bonus history available

No Rights history available
Quality key factors
Valuation key factors
Technicals key factors
 Technical Indicator Scale: Bearish, Mildly Bearish, Sideways, Mildly Bullish, Bullish Turned
 Shareholding Snapshot : Mar 2026
Shareholding Compare (%holding)
Promoters
None
Held by 8 Schemes (32.28%)
Held by 86 FIIs (6.65%)
Prism International Private Limited (24.09%)
Hdfc Small Cap Fund (9.46%)
21.64%
Quarterly Results Snapshot (Consolidated) - Mar'26 - QoQ

QoQ Growth in quarter ended Mar 2026 is -4.78% vs -1.22% in Dec 2025
QoQ Growth in quarter ended Mar 2026 is -10.69% vs 1.30% in Dec 2025
Half Yearly Results Snapshot (Consolidated) - Sep'25

Growth in half year ended Sep 2025 is 50.42% vs -3.27% in Sep 2024
Growth in half year ended Sep 2025 is 17.16% vs -20.13% in Sep 2024
Nine Monthly Results Snapshot (Consolidated) - Dec'25
YoY Growth in nine months ended Dec 2025 is 46.48% vs -1.34% in Dec 2024
YoY Growth in nine months ended Dec 2025 is -65.41% vs 183.07% in Dec 2024
Annual Results Snapshot (Consolidated) - Mar'26
YoY Growth in year ended Mar 2026 is 31.61% vs 9.40% in Mar 2025
YoY Growth in year ended Mar 2026 is -31.06% vs 44.74% in Mar 2025
About Gateway Distriparks Ltd

Company Coordinates


