
Compare Gaudium IVF with Similar Stocks
Stock DNA
Healthcare Services
INR 988 Cr (Micro Cap)
34.00
63
0.00%
0.10
16.08%
6.21
Total Returns (Price + Dividend) 
Gaudium IVF for the last several years.
Risk Adjusted Returns v/s
Returns Beta

News
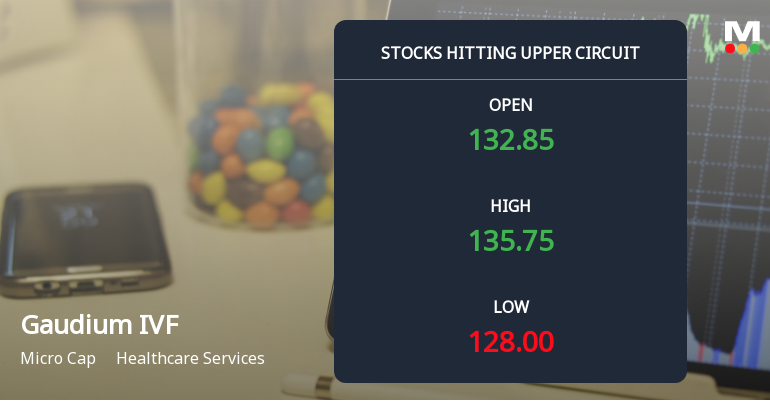
Gaudium IVF and Women Health Ltd Locks at Upper Circuit With 5.0% Gain — Buyers Queue, Sellers Absent
At Rs 136.52, the buying was done — not because demand dried up, but because the exchange wouldn't let the stock go any higher. Gaudium IVF and Women Health Ltd locked at its upper circuit of 5.0% on 14 Jul 2026, with buyers queuing and no sellers willing to part with shares.
Read full news article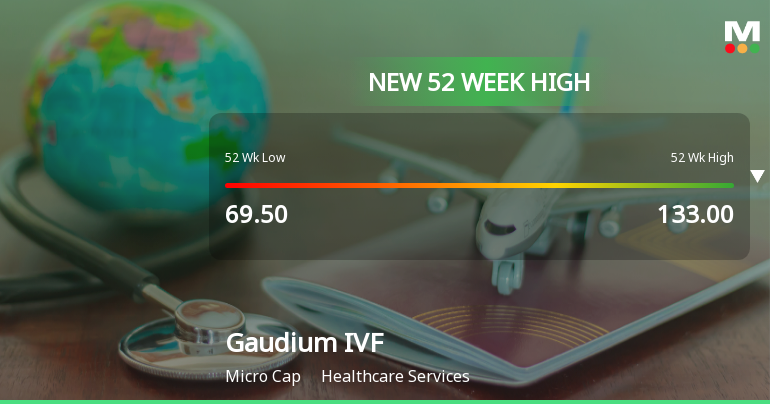
Broad-Based Technical Strength Lifts Gaudium IVF and Women Health Ltd to 52-Week High of Rs 135.5
After a sustained four-day rally delivering nearly 20% returns, Gaudium IVF and Women Health Ltd surged to a fresh 52-week and all-time high of Rs 135.5 on 14 Jul 2026, outperforming its healthcare services sector by 4.63% on the day despite a broadly weaker market backdrop.
Read full news article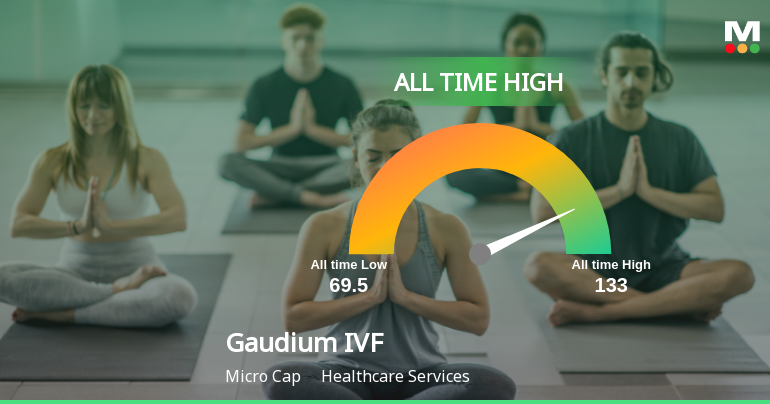
Strong Momentum Meets Stretched Valuations as Gaudium IVF and Women Health Ltd Reaches All-Time High
After a steady climb over recent weeks, Gaudium IVF and Women Health Ltd touched a fresh all-time high of Rs 135.50 on 14 Jul 2026, marking a significant milestone for the healthcare services micro-cap. This surge comes amid a broader sideways technical trend and stretched valuation multiples, raising questions about the sustainability of the current momentum.
Read full news article Announcements
Compliances-Certificate under Reg. 74 (5) of SEBI (DP) Regulations 2018
11-Jul-2026 | Source : BSECompliance Certificate under Regulation 74(5) of Securities and Exchange Board of India (Depositories and Participants) Regulations 2018 for the quarter ended June 30 2026
Closure of Trading Window
26-Jun-2026 | Source : BSEGaudium IVF and Women Health Limited has informed the Exchange regarding the Trading Window closure pursuant to SEBI (Prohibition of Insider Trading) Regulations 2015
Gaudium IVF And Women Health Limited Has Informed The Exchange About Corrigendum To The Financial Results Submitted For The Quarter And Year Ended March 31 2026
25-Jun-2026 | Source : BSEGaudium IVF and Women Health Limited has informed the Exchange about Corrigendum to the Financial Results submitted for the quarter and year ended March 31 2026
Corporate Actions

No Upcoming Board Meetings

No Dividend history available

No Splits history available

No Bonus history available

No Rights history available
Quality key factors
Valuation key factors
Technicals key factors
 Technical Indicator Scale: Bearish, Mildly Bearish, Sideways, Mildly Bullish, Bullish Turned
 Shareholding Snapshot : Mar 2026
Shareholding Compare (%holding)
Promoters
None
Held by 0 Schemes
Held by 6 FIIs (6.7%)
Manika Khanna (70.73%)
Mukul Mahavir Agrawal (3.43%)
14.67%
Quarterly Results Snapshot (Standalone) - Mar'26 - QoQ

QoQ Growth in quarter ended Mar 2026 is 56.24% vs -38.17% in Dec 2025
QoQ Growth in quarter ended Mar 2026 is 143.08% vs -64.78% in Dec 2025
Annual Results Snapshot (Standalone) - Mar'26
YoY Growth in year ended Mar 2026 is 21.32% vs 12.98% in Mar 2025
YoY Growth in year ended Mar 2026 is 19.65% vs 11.96% in Mar 2025
About Gaudium IVF and Women Health Ltd

Company Coordinates


