
Compare Gautam Gems with Similar Stocks
Dashboard
Weak Long Term Fundamental Strength with a -6.63% CAGR growth in Operating Profits over the last 5 years
- Company's ability to service its debt is weak with a poor EBIT to Interest (avg) ratio of 0.81
- The company has been able to generate a Return on Equity (avg) of 1.87% signifying low profitability per unit of shareholders funds
Flat results in Mar 26
57.93% of Promoter Shares are Pledged
Consistent Underperformance against the benchmark over the last 3 years
Stock DNA
Gems, Jewellery And Watches
INR 13 Cr (Micro Cap)
19.00
45
0.00%
0.10
1.35%
0.26
Total Returns (Price + Dividend) 
Gautam Gems for the last several years.
Risk Adjusted Returns v/s
Returns Beta

News
Are Gautam Gems Ltd latest results good or bad?
Gautam Gems Ltd's latest financial results for Q4 FY26 present a complex picture. The company reported a net profit of ₹0.41 crore, reflecting a significant year-on-year growth of 1,266.67%, which is a notable recovery from the previous quarter's profit of ₹0.09 crore. However, this improvement is largely attributed to a substantial increase in other income, which accounted for a significant portion of the operating profit, raising concerns about the sustainability of this profit growth. On the revenue front, Gautam Gems recorded ₹20.22 crore, which represents a decline of 11.20% compared to the same quarter last year. Although this figure shows a quarter-on-quarter recovery of 56.14% from a low of ₹12.95 crore in Q3 FY26, it still indicates that the company is struggling to maintain consistent revenue levels year-on-year. The operating margin has compressed to 0.54%, marking a multi-quarter low, which sug...
Read full news article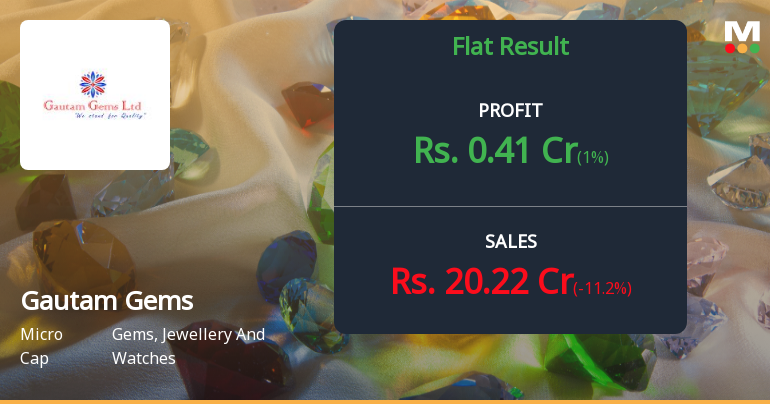
Gautam Gems Q4 FY26: Profit Surge Masks Persistent Revenue Decline and Margin Weakness
Gautam Gems Limited, a Surat-based diamond manufacturer and trader, reported a net profit of ₹0.41 crores for Q4 FY26, representing a substantial sequential improvement of 355.56% over Q3 FY26's ₹0.09 crores. However, the quarter's performance reveals a concerning narrative beneath the surface: net sales declined 11.20% year-on-year to ₹20.22 crores, whilst operating margins contracted sharply to a multi-quarter low of 0.54%. The stock, currently trading at ₹3.30 with a market capitalisation of ₹14.00 crores, has declined 30.82% over the past year, significantly underperforming both the Sensex and its sector peers.
Read full news article
Gautam Gems Ltd Upgraded to Sell as Technicals Improve Amidst Mixed Fundamentals
Gautam Gems Ltd, a micro-cap player in the Gems, Jewellery and Watches sector, has seen its investment rating upgraded from Strong Sell to Sell as of 7 April 2026. This change is primarily driven by a shift in technical indicators, even as the company continues to face significant fundamental challenges including weak financial trends and profitability concerns.
Read full news article Announcements
Disclosures under Reg. 29(2) of SEBI (SAST) Regulations 2011
03-Jun-2026 | Source : BSEThe Exchange has received the disclosure under Regulation 29(2) of SEBI (Substantial Acquisition of Shares & Takeovers) Regulations 2011 for Veeram Barter Pvt Ltd & PACs
Compliances-Reg.24(A)-Annual Secretarial Compliance
29-May-2026 | Source : BSEAnnual Secretarial Compliance Report for the financial year ended 31st March 2026 under regulation 24A of SEBI (LODR) Regulations 2015 is attached herewith
Board Meeting Outcome for Revised Outcome For The Meeting Of Board Of Directors Held On 28Th May 2026
29-May-2026 | Source : BSERevised outcome for the Board of Directors Meeting held on 28th May 2026 there was some clerical error as attached
Corporate Actions

No Upcoming Board Meetings

No Dividend history available

No Splits history available

No Bonus history available

Gautam Gems Ltd has announced 4:1 rights issue, ex-date: 01 Sep 22
Quality key factors
Valuation key factors
Technicals key factors
 Technical Indicator Scale: Bearish, Mildly Bearish, Sideways, Mildly Bullish, Bullish Turned
 Shareholding Snapshot : Mar 2026
Shareholding Compare (%holding)
Non Institution
57.9309
Held by 0 Schemes
Held by 0 FIIs
Gautam Pravinchandra Sheth (21.8%)
Vivid Mercantile Limited (12.75%)
58.37%
Quarterly Results Snapshot (Standalone) - Mar'26 - YoY

YoY Growth in quarter ended Mar 2026 is -11.20% vs -19.00% in Mar 2025
YoY Growth in quarter ended Mar 2026 is 1,266.67% vs 116.67% in Mar 2025
Half Yearly Results Snapshot (Standalone) - Sep'25
Growth in half year ended Sep 2025 is 9.61% vs -16.61% in Sep 2024
Growth in half year ended Sep 2025 is 23.53% vs -58.54% in Sep 2024
Nine Monthly Results Snapshot (Standalone) - Dec'25
YoY Growth in nine months ended Dec 2025 is 7.05% vs -55.24% in Dec 2024
YoY Growth in nine months ended Dec 2025 is 0.00% vs -70.87% in Dec 2024
Annual Results Snapshot (Standalone) - Mar'26
YoY Growth in year ended Mar 2026 is 1.75% vs -22.70% in Mar 2025
YoY Growth in year ended Mar 2026 is 150.00% vs -26.32% in Mar 2025
About Gautam Gems Ltd

Company Coordinates


