
Compare Gayatri BioOrga. with Similar Stocks
Dashboard
With a Negative Book Value, the company has a Weak Long Term Fundamental Strength
- Poor long term growth as Net Sales has grown by an annual rate of % and Operating profit at 0% over the last 5 years
- The company has a negative book value of Rs 37.00 crore
Flat results in Mar 26
Risky - Negative EBITDA
Stock DNA
Commodity Chemicals
INR 57 Cr (Micro Cap)
NA (Loss Making)
45
0.00%
-1.02
2.73%
-1.59
Total Returns (Price + Dividend) 
Gayatri BioOrga. for the last several years.
Risk Adjusted Returns v/s
Returns Beta

News
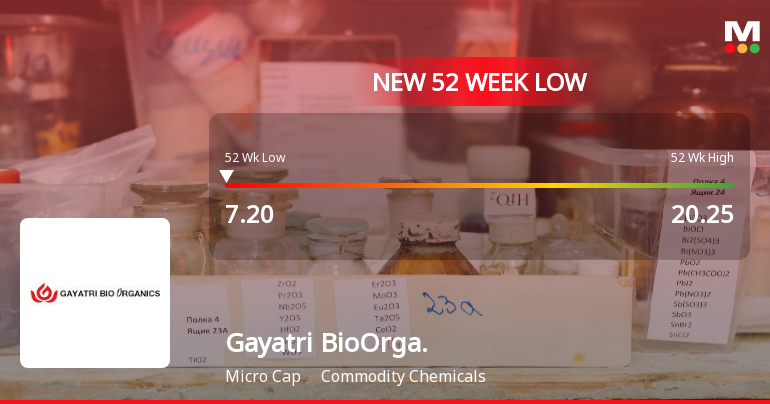
Gayatri BioOrganics Ltd Falls to 52-Week Low of Rs 7.2 as Sell-Off Deepens
For the second consecutive session, Gayatri BioOrganics Ltd has seen its share price decline, hitting a fresh 52-week low of Rs 7.2 on 1 Jul 2026. This drop comes despite the broader market's modest gains, underscoring stock-specific pressures weighing on the micro-cap commodity chemicals firm.
Read full news article
Gayatri BioOrganics Ltd is Rated Strong Sell
Gayatri BioOrganics Ltd is rated Strong Sell by MarketsMOJO, with this rating last updated on 01 June 2026. However, the analysis and financial metrics discussed here reflect the company’s current position as of 29 June 2026, providing investors with the latest insights into its performance and outlook.
Read full news article
Gayatri BioOrganics Ltd is Rated Strong Sell
Gayatri BioOrganics Ltd is rated Strong Sell by MarketsMOJO, with this rating last updated on 01 June 2026. However, the analysis and financial metrics discussed here reflect the stock’s current position as of 17 June 2026, providing investors with the latest insights into the company’s performance and outlook.
Read full news article Announcements
Closure of Trading Window
23-Jun-2026 | Source : BSEClosure of trading window for Unaudited Financial Results for the quarter ended 30.06.2026
Compliances-Reg.24(A)-Annual Secretarial Compliance
27-May-2026 | Source : BSEAnnual Secretarial Compliance Report for the Year ended 31.03.2026
Audited Financial Results Along With Audit Report For The Quarter And Year Ended 31.03.2026
19-May-2026 | Source : BSEAudited Financial Results along with Audit Report for quarter and year ended 31.03.2026
Corporate Actions

No Upcoming Board Meetings

No Dividend history available

No Splits history available

No Bonus history available

No Rights history available
Quality key factors
Valuation key factors
Technicals key factors
 Technical Indicator Scale: Bearish, Mildly Bearish, Sideways, Mildly Bullish, Bullish Turned
 Shareholding Snapshot : Mar 2026
Shareholding Compare (%holding)
Non Institution
None
Held by 3 Schemes (0.65%)
Held by 1 FIIs (0.01%)
Sandeep Kumar Reddy Tikkavarapu (21.59%)
Fursa Mauritius Spv 1 (23.48%)
52.91%
Quarterly Results Snapshot (Standalone) - Mar'26 - YoY
YoY Growth in quarter ended Mar 2026 is 0.00% vs 0.00% in Mar 2025

YoY Growth in quarter ended Mar 2026 is -147.06% vs 26.09% in Mar 2025
Half Yearly Results Snapshot (Standalone) - Sep'25
Growth in half year ended Sep 2025 is 0.00% vs 0.00% in Sep 2024

Growth in half year ended Sep 2025 is -20.51% vs -25.81% in Sep 2024
Nine Monthly Results Snapshot (Standalone) - Dec'25
YoY Growth in nine months ended Dec 2025 is 0.00% vs 0.00% in Dec 2024
YoY Growth in nine months ended Dec 2025 is -25.45% vs -22.22% in Dec 2024
Annual Results Snapshot (Standalone) - Mar'26
YoY Growth in year ended Mar 2026 is 0.00% vs 0.00% in Mar 2025
YoY Growth in year ended Mar 2026 is -52.05% vs -7.35% in Mar 2025
About Gayatri BioOrganics Ltd

Company Coordinates


