
Compare Gayatri Projects with Similar Stocks
Dashboard
Weak Long Term Fundamental Strength with an average Return on Capital Employed (ROCE) of 0%
- Poor long term growth as Net Sales has grown by an annual rate of -26.32% and Operating profit at -160.79% over the last 5 years
- Company's ability to service its debt is weak with a poor EBIT to Interest (avg) ratio of -5.96
Risky - Negative EBITDA
Stock DNA
Construction
INR 1,017 Cr (Micro Cap)
12.00
44
0.00%
0.48
12.78%
1.67
Total Returns (Price + Dividend) 
Latest dividend: 2 per share ex-dividend date: Sep-21-2016
Risk Adjusted Returns v/s
Returns Beta

News
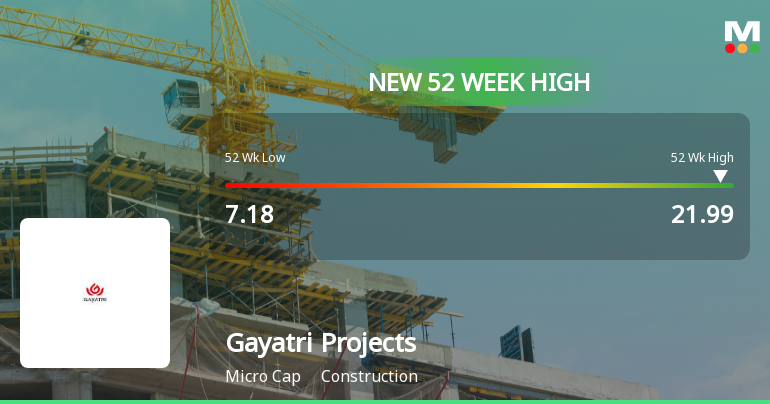
Broad-Based Technical Strength Lifts Gayatri Projects Ltd to 52-Week High of Rs 21.99
With a remarkable 143.33% gain over the past year, Gayatri Projects Ltd surged to a fresh 52-week high of Rs 21.99 on 11 Jun 2026, defying the broader market's subdued performance and signalling robust price momentum.
Read full news article
Broad-Based Technical Strength Lifts Gayatri Projects Ltd to 52-Week High of Rs 21.75
With a sustained five-day rally culminating in a fresh 52-week high of Rs 21.75 on 10 Jun 2026, Gayatri Projects Ltd has demonstrated remarkable price momentum, outpacing its construction sector peers and the broader market.
Read full news article
Gayatri Projects Ltd is Rated Sell
Gayatri Projects Ltd is rated 'Sell' by MarketsMOJO, with this rating last updated on 14 May 2026. However, the analysis and financial metrics discussed here reflect the stock's current position as of 03 June 2026, providing investors with an up-to-date view of the company’s fundamentals, valuation, financial trends, and technical outlook.
Read full news article Announcements
Compliances-Reg.24(A)-Annual Secretarial Compliance
30-May-2026 | Source : BSEPlease enclosed the Annual Secretarial Compliance Report u/Reg 24A of the SEBI (LODR) Regulations 2015 for the year ended 31st March 2026
Audited Financial Results For 31St March 2026
14-May-2026 | Source : BSEPlease find enclosed Audited Standalone and Consolidated financial results for the quarter and year ended 31st March 2026
Board Meeting Outcome for Audited Financial Results For 31St March 2026
14-May-2026 | Source : BSEPlease find enclosed the Audited Standalone and Consolidated financial results for the quarter and year ended 31st March 2026
Corporate Actions

No Upcoming Board Meetings

Gayatri Projects Ltd has declared 20% dividend, ex-date: 21 Sep 16

Gayatri Projects Ltd has announced 2:10 stock split, ex-date: 10 Feb 17

No Bonus history available

Gayatri Projects Ltd has announced 1:1 rights issue, ex-date: 22 Feb 12
Quality key factors
Valuation key factors
Technicals key factors
 Technical Indicator Scale: Bearish, Mildly Bearish, Sideways, Mildly Bullish, Bullish Turned
 Shareholding Snapshot : Apr 2026
Shareholding Compare (%holding)
Non Institution
4.9785
Held by 0 Schemes
Held by 9 FIIs (12.62%)
Indira Subbaramireddy Tikkavarapu (2.32%)
Antara India Evergreen Fund (11.82%)
25.76%
Quarterly Results Snapshot (Consolidated) - Mar'26 - YoY

YoY Growth in quarter ended Mar 2026 is 39.52% vs -16.61% in Mar 2025

YoY Growth in quarter ended Mar 2026 is -169.95% vs 80.80% in Mar 2025
Half Yearly Results Snapshot (Consolidated) - Sep'25
Growth in half year ended Sep 2025 is -32.55% vs -42.35% in Sep 2024
Growth in half year ended Sep 2025 is 87.94% vs 3.21% in Sep 2024
Nine Monthly Results Snapshot (Consolidated) - Dec'25
YoY Growth in nine months ended Dec 2025 is 109.58% vs -39.28% in Dec 2024
YoY Growth in nine months ended Dec 2025 is 6,287.13% vs 24.87% in Dec 2024
Annual Results Snapshot (Consolidated) - Mar'26
YoY Growth in year ended Mar 2026 is 88.23% vs -33.79% in Mar 2025
YoY Growth in year ended Mar 2026 is 1,548.33% vs 198.82% in Mar 2025
About Gayatri Projects Ltd

Company Coordinates


