
Compare Gayatri Sugars with Similar Stocks
Dashboard
With a Negative Book Value, the company has a Weak Long Term Fundamental Strength
- Poor long term growth as Net Sales has grown by an annual rate of 8.13% and Operating profit at 0% over the last 5 years
- The company has a negative book value of Rs 124.71 crore
Risky - Negative Book Value
39.6% of Promoter Shares are Pledged
Underperformed the market in the last 1 year
Total Returns (Price + Dividend) 
Gayatri Sugars for the last several years.
Risk Adjusted Returns v/s
Returns Beta

News
Gayatri Sugars Ltd is Rated Strong Sell
Gayatri Sugars Ltd is rated Strong Sell by MarketsMOJO, with this rating last updated on 17 Nov 2025. However, the analysis and financial metrics discussed here reflect the company’s current position as of 26 May 2026, providing investors with an up-to-date view of the stock’s fundamentals, valuation, financial trends, and technical outlook.
Read full news articleAre Gayatri Sugars Ltd latest results good or bad?
Gayatri Sugars Ltd's latest financial results for Q4 FY26 showcase a significant transformation in its operational performance compared to the previous quarter. The company reported net sales of ₹243.81 crores, reflecting a quarter-on-quarter growth of 200.37%, driven by the peak sugar crushing season. This is a notable recovery from a loss of ₹5.68 crores in the previous quarter, marking a substantial turnaround to a net profit of ₹46.50 crores in Q4 FY26. The operating margin improved to 16.38%, up from 3.61% in Q3 FY26, indicating enhanced operational efficiency during this peak production period. Additionally, the profit after tax (PAT) margin reached 19.07%, a significant improvement from a negative margin in the prior quarter, aided by an interest reversal of ₹8.03 crores and zero tax outgo. However, while the quarterly results appear strong, they are heavily influenced by seasonal factors, raising ...
Read full news article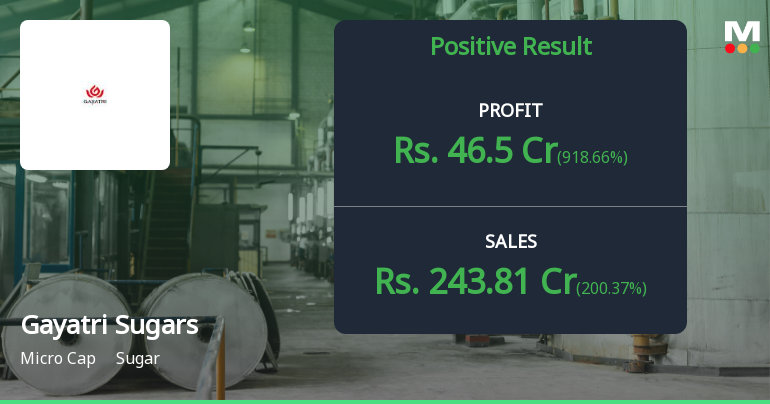
Gayatri Sugars Q4 FY26: Crushing Season Delivers Stellar Turnaround, But Structural Concerns Persist
Gayatri Sugars Ltd., a Telangana-based integrated sugar and ethanol manufacturer, reported a dramatic quarterly turnaround in Q4 FY26, swinging to a net profit of ₹46.50 crores from a loss of ₹18.60 crores in the previous quarter. This represents the company's strongest quarterly performance in recent years, driven primarily by the peak crushing season. However, the stock remains under pressure, trading at ₹8.95 with a market capitalisation of just ₹66.50 crores, down 46.38% from its 52-week high of ₹16.69. The company's negative book value of ₹-11.65 per share and elevated debt levels continue to weigh on investor sentiment despite the operational improvement.
Read full news article Announcements
Results For The Quarter And Financial Year Ended 31St March 2026
21-May-2026 | Source : BSEResults for the quarter and financial year ended 31st March 2026
Announcement under Regulation 30 (LODR)-Change in Management
21-May-2026 | Source : BSEAppointment of cost auditors
Announcement under Regulation 30 (LODR)-Change in Management
21-May-2026 | Source : BSEAppointment of Internal Auditors
Corporate Actions

No Upcoming Board Meetings

No Dividend history available

No Splits history available

No Bonus history available

No Rights history available
Quality key factors
Valuation key factors
Technicals key factors
 Technical Indicator Scale: Bearish, Mildly Bearish, Sideways, Mildly Bullish, Bullish Turned
 Shareholding Snapshot : Mar 2026
Shareholding Compare (%holding)
Non Institution
39.6027
Held by 0 Schemes
Held by 0 FIIs
T.s.r.holdings Pvt Ltd (16.4%)
Mohan Project Contractors P Ltd (3.29%)
47.34%
Quarterly Results Snapshot (Standalone) - Mar'26 - QoQ

QoQ Growth in quarter ended Mar 2026 is 200.37% vs 498.60% in Dec 2025

QoQ Growth in quarter ended Mar 2026 is 918.66% vs 73.22% in Dec 2025
Half Yearly Results Snapshot (Standalone) - Sep'25
Growth in half year ended Sep 2025 is 32.22% vs -59.19% in Sep 2024
Growth in half year ended Sep 2025 is -2.02% vs -39.91% in Sep 2024
Nine Monthly Results Snapshot (Standalone) - Dec'25
YoY Growth in nine months ended Dec 2025 is -12.97% vs -7.63% in Dec 2024
YoY Growth in nine months ended Dec 2025 is -20.41% vs -42.19% in Dec 2024
Annual Results Snapshot (Standalone) - Mar'26
YoY Growth in year ended Mar 2026 is 9.01% vs -10.87% in Mar 2025
YoY Growth in year ended Mar 2026 is -5.61% vs -84.80% in Mar 2025
About Gayatri Sugars Ltd

Company Coordinates


