
Compare GE Vernova T&D with Similar Stocks
Dashboard
High Management Efficiency with a high ROE of 16.31%
Strong ability to service debt as the company has a low Debt to EBITDA ratio of 0.03 times
Healthy long term growth as Operating profit has grown by an annual rate 83.13%
With a growth in Net Profit of 88.63%, the company declared Very Positive results in Mar 26
High Institutional Holdings at 41.78%
Company is among the highest 1% of companies rated by MarketsMojo across all 4,000 stocks
Stock DNA
Heavy Electrical Equipment
INR 117,154 Cr (Mid Cap)
94.00
40
0.11%
-0.41
61.38%
53.81
Total Returns (Price + Dividend) 
Latest dividend: 5 per share ex-dividend date: Aug-22-2025
Risk Adjusted Returns v/s
Returns Beta

News

GE Vernova T&D India Ltd Sees Surge in Value Trading Amid Strong Market Momentum
GE Vernova T&D India Ltd (GVT&D) has emerged as one of the most actively traded stocks by value on 20 May 2026, reflecting robust investor interest and significant institutional participation. The mid-cap heavy electrical equipment company witnessed a remarkable 6.84% gain in its share price, outperforming its sector and broader market indices amid strong volume and value turnover.
Read full news article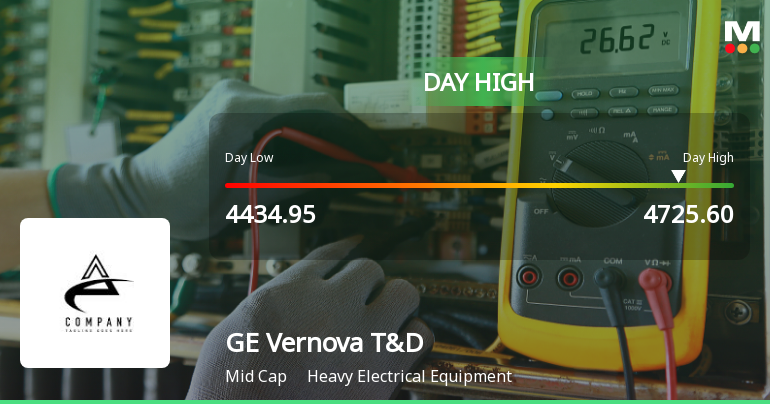
GE Vernova T&D India Ltd Surges 7.44% to Day's High of Rs 4629.6 — Outperforms Sector by 4.62 Percentage Points
While the Sensex struggled with a 0.38% decline on 20 May 2026, GE Vernova T&D India Ltd recorded a robust 7.44% gain, touching an intraday high of Rs 4629.6. This 4.62 percentage-point outperformance over its Heavy Electrical Equipment sector peers highlights a distinctly stock-specific rally rather than a market-wide uplift.
Read full news articleAre GE Vernova T&D India Ltd latest results good or bad?
GE Vernova T&D India Ltd's financial results for the quarter ending March 2026 reflect a strong operational performance, characterized by significant year-on-year growth in both revenue and net profit. The company reported net sales of ₹1,637.08 crores, marking a 42.04% increase compared to ₹1,152.54 crores in the same quarter last year. This growth is indicative of robust order execution and healthy demand within India's power infrastructure sector. Net profit for the quarter reached ₹351.77 crores, representing an 88.63% increase from the previous year, driven by operational efficiencies and margin expansion. The operating profit, excluding other income, also saw a substantial rise to ₹444.94 crores, reflecting a 76.47% increase from ₹252.14 crores in the prior year. The operating margin improved to 27.18%, up from 21.88% year-on-year, showcasing the company's ability to manage costs effectively despite ...
Read full news article Announcements
Shareholder Meeting / Postal Ballot-Outcome of Postal_Ballot
19-May-2026 | Source : BSEDeclaration of Results of Postal Ballot
Announcement under Regulation 30 (LODR)-Investor Presentation
19-May-2026 | Source : BSEAnalyst Presentation
Announcement under Regulation 30 (LODR)-Analyst / Investor Meet - Outcome
19-May-2026 | Source : BSEAudio recording of the Earnings Conference call held on May 19 2026
Corporate Actions

No Upcoming Board Meetings

GE Vernova T&D India Ltd has declared 250% dividend, ex-date: 22 Aug 25

GE Vernova T&D India Ltd has announced 2:10 stock split, ex-date: 22 Oct 08

No Bonus history available

No Rights history available
Quality key factors
Valuation key factors
Technicals key factors
 Technical Indicator Scale: Bearish, Mildly Bearish, Sideways, Mildly Bullish, Bullish Turned
 Shareholding Snapshot : Mar 2026
Shareholding Compare (%holding)
Promoters
None
Held by 39 Schemes (18.03%)
Held by 848 FIIs (20.39%)
Grid Equipments Private Limited (50.7%)
Kotak Midcap Fund (4.28%)
5.36%
Quarterly Results Snapshot (Standalone) - Mar'26 - YoY

YoY Growth in quarter ended Mar 2026 is 42.04% vs 26.15% in Mar 2025

YoY Growth in quarter ended Mar 2026 is 88.63% vs 181.32% in Mar 2025
Half Yearly Results Snapshot (Standalone) - Sep'25
Growth in half year ended Sep 2025 is 38.84% vs 45.98% in Sep 2024
Growth in half year ended Sep 2025 is 111.59% vs 326.78% in Sep 2024
Nine Monthly Results Snapshot (Standalone) - Dec'25
YoY Growth in nine months ended Dec 2025 is 45.53% vs 39.28% in Dec 2024
YoY Growth in nine months ended Dec 2025 is 108.96% vs 267.58% in Dec 2024
Annual Results Snapshot (Standalone) - Mar'26
YoY Growth in year ended Mar 2026 is 44.59% vs 35.49% in Mar 2025
YoY Growth in year ended Mar 2026 is 102.73% vs 236.00% in Mar 2025
About GE Vernova T&D India Ltd

Company Coordinates


