
Compare GE Vernova T&D with Similar Stocks
Dashboard
High Management Efficiency with a high ROE of 16.31%
Strong ability to service debt as the company has a low Debt to EBITDA ratio of 0.03 times
Healthy long term growth as Operating profit has grown by an annual rate 55.73%
With a growth in Net Profit of 88.63%, the company declared Very Positive results in Mar 26
High Institutional Holdings at 41.78%
Company is among the highest 1% of companies rated by MarketsMojo across all 4,000 stocks
Stock DNA
Heavy Electrical Equipment
INR 115,477 Cr (Mid Cap)
88.00
40
0.11%
-0.41
61.38%
53.81
Total Returns (Price + Dividend) 
Latest dividend: 5 per share ex-dividend date: Aug-22-2025
Risk Adjusted Returns v/s
Returns Beta

News
Are GE Vernova T&D India Ltd latest results good or bad?
GE Vernova T&D India Ltd's financial results for the quarter ending March 2026 reflect a strong operational performance, characterized by significant year-on-year growth in both revenue and net profit. The company reported net sales of ₹1,637.08 crores, marking a 42.04% increase compared to ₹1,152.54 crores in the same quarter last year. This growth is indicative of robust order execution and healthy demand within India's power infrastructure sector. Net profit for the quarter reached ₹351.77 crores, representing an 88.63% increase from the previous year, driven by operational efficiencies and margin expansion. The operating profit, excluding other income, also saw a substantial rise to ₹444.94 crores, reflecting a 76.47% increase from ₹252.14 crores in the prior year. The operating margin improved to 27.18%, up from 21.88% year-on-year, showcasing the company's ability to manage costs effectively despite ...
Read full news article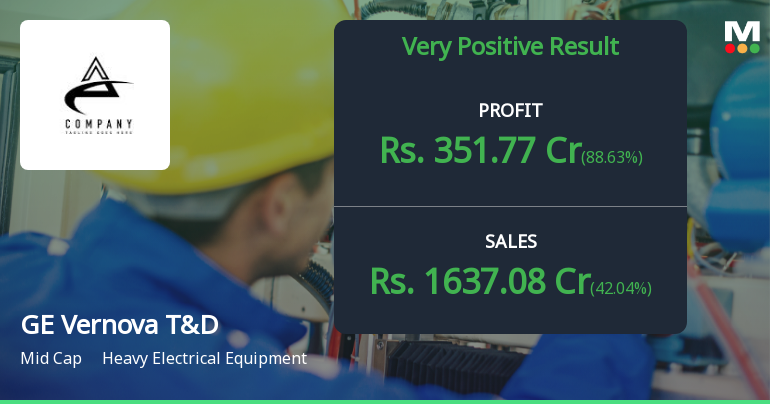
GE Vernova T&D India Q4 FY26: Stellar Growth Momentum Continues Despite Valuation Concerns
GE Vernova T&D India Ltd., a leading player in India's power transmission and distribution infrastructure sector, delivered another robust quarter in Q4 FY26 (Mar'26), with net profit surging 88.62% year-on-year to ₹351.77 crores, whilst revenue expanded 42.04% to ₹1,637.08 crores. The company, commanding a market capitalisation of ₹1,12,374.98 crores, continues to capitalise on India's infrastructure buildout, though its shares traded at ₹4,388.85 as of May 19, 2026, down 0.95% on the day, reflecting investor caution around stretched valuations.
Read full news article
GE Vernova T&D India Ltd is Rated Strong Buy
GE Vernova T&D India Ltd is rated Strong Buy by MarketsMOJO, with this rating last updated on 02 Feb 2026. However, the analysis and financial metrics discussed here reflect the company’s current position as of 14 May 2026, providing investors with the latest insights into its performance and outlook.
Read full news article Announcements
Announcement under Regulation 30 (LODR)-Dividend Updates
18-May-2026 | Source : BSEBoard of directors at its meeting held today has recommended a final dividend @ 500 i.e. Rs. 10 per equity share subject to the approval of the shareholders at the ensuing Annual General Meeting.
Intimation Under Regulation 30 SEBI (Listing Obligation & Disclosure Requirements) Regulation 2015.
18-May-2026 | Source : BSEThe Board of Directors at its meeting held today have inter-alia: 1. Approved the re-appointment of M/s. Deloitte Haskins & Sells Chartered Accounts (Firm Registration Number: 015125N) as Statutory Auditors of the Company for a term of 5 consecutive years subject to the approval of the shareholders. 2. Approve the appointment of M/s. Ramanath Iyer & Co. Cost Accountants as Cost auditors of the company for the financial year 2026-27.
Announcement under Regulation 30 (LODR)-Press Release / Media Release
18-May-2026 | Source : BSEPress Release
Corporate Actions

No Upcoming Board Meetings

GE Vernova T&D India Ltd has declared 250% dividend, ex-date: 22 Aug 25

GE Vernova T&D India Ltd has announced 2:10 stock split, ex-date: 22 Oct 08

No Bonus history available

No Rights history available
Quality key factors
Valuation key factors
Technicals key factors
 Technical Indicator Scale: Bearish, Mildly Bearish, Sideways, Mildly Bullish, Bullish Turned
 Shareholding Snapshot : Mar 2026
Shareholding Compare (%holding)
Promoters
None
Held by 39 Schemes (18.03%)
Held by 848 FIIs (20.39%)
Grid Equipments Private Limited (50.7%)
Kotak Midcap Fund (4.28%)
5.36%
Quarterly Results Snapshot (Standalone) - Mar'26 - YoY

YoY Growth in quarter ended Mar 2026 is 42.04% vs 26.15% in Mar 2025

YoY Growth in quarter ended Mar 2026 is 88.63% vs 181.32% in Mar 2025
Half Yearly Results Snapshot (Standalone) - Sep'25
Growth in half year ended Sep 2025 is 38.84% vs 45.98% in Sep 2024
Growth in half year ended Sep 2025 is 111.59% vs 326.78% in Sep 2024
Nine Monthly Results Snapshot (Standalone) - Dec'25
YoY Growth in nine months ended Dec 2025 is 45.53% vs 39.28% in Dec 2024
YoY Growth in nine months ended Dec 2025 is 108.96% vs 267.58% in Dec 2024
Annual Results Snapshot (Standalone) - Mar'26
YoY Growth in year ended Mar 2026 is 44.59% vs 35.49% in Mar 2025
YoY Growth in year ended Mar 2026 is 102.73% vs 236.00% in Mar 2025
About GE Vernova T&D India Ltd

Company Coordinates


