
Compare GEE with Similar Stocks
Dashboard
Weak Long Term Fundamental Strength with an average Return on Capital Employed (ROCE) of 7.14%
- Poor long term growth as Net Sales has grown by an annual rate of 7.88% and Operating profit at 6.62% over the last 5 years
With a growth in Operating Profit of 39.84%, the company declared Very Positive results in Mar 26
With ROCE of 10.6, it has a Attractive valuation with a 1.8 Enterprise value to Capital Employed
43.36% of Promoter Shares are Pledged
Stock DNA
Other Electrical Equipment
INR 427 Cr (Micro Cap)
29.00
40
0.00%
0.29
6.91%
1.98
Total Returns (Price + Dividend) 
Latest dividend: 0.3 per share ex-dividend date: Sep-19-2018
Risk Adjusted Returns v/s
Returns Beta

News

GEE Ltd is Rated Sell by MarketsMOJO
GEE Ltd is rated 'Sell' by MarketsMOJO, with this rating last updated on 16 May 2026. However, the analysis and financial metrics presented here reflect the stock's current position as of 03 June 2026, providing investors with the latest insights into the company’s fundamentals, valuation, financial trends, and technical outlook.
Read full news article
GEE Ltd is Rated Sell by MarketsMOJO
GEE Ltd is rated 'Sell' by MarketsMOJO, with this rating last updated on 16 May 2026. While the rating was revised on that date, the analysis and financial metrics discussed here reflect the stock's current position as of 23 May 2026, providing investors with an up-to-date view of the company’s fundamentals, returns, and technical outlook.
Read full news article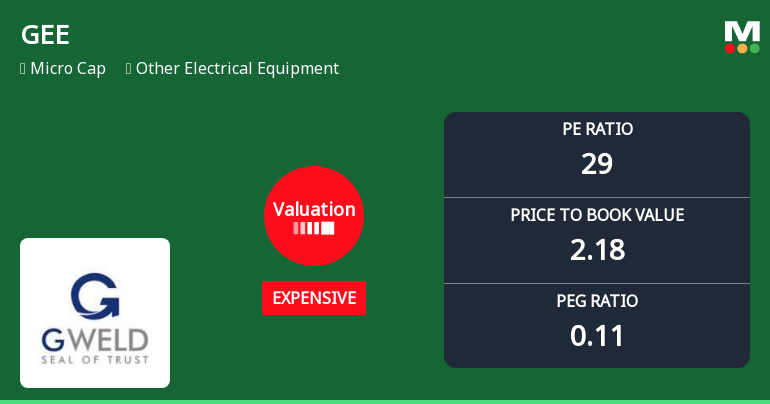
GEE Ltd Valuation Shifts Signal Changing Price Attractiveness Amid Mixed Financial Metrics
GEE Ltd, a micro-cap player in the Other Electrical Equipment sector, has witnessed a notable shift in its valuation parameters, moving from a very expensive to an expensive rating. Despite this improvement, the company’s financial metrics remain mixed, with a modest return on equity contrasting a negative return on capital employed. This article analyses the recent valuation changes, compares GEE Ltd’s price multiples with peers and historical averages, and assesses the implications for investors amid a volatile market backdrop.
Read full news article Announcements
Compliances-Reg.24(A)-Annual Secretarial Compliance
29-May-2026 | Source : BSEAnnual Secretarial Compliance Report under Regulation 24A of SEBI (LODR) Regulations 2015 for the Financial Year Ended 31st March 2026.
Announcement under Regulation 30 (LODR)-Earnings Call Transcript
21-May-2026 | Source : BSETranscript of Investors Conference Call held on 18th May 2026 for Q4 and year ended 31st March 2026.
Clarification / Continuation To Our Outcome Of Board Meeting Letter Dated 15Th May 2026 - Inadvertent Omission Of Certificate From Statutory Auditor
21-May-2026 | Source : BSECertificate from Statutory Auditors - End use of proceeds raised through issue of preferential warrants
Corporate Actions

No Upcoming Board Meetings

GEE Ltd has declared 15% dividend, ex-date: 19 Sep 18

GEE Ltd has announced 2:10 stock split, ex-date: 10 Jan 08

GEE Ltd has announced 1:1 bonus issue, ex-date: 03 Oct 25

GEE Ltd has announced 4:1 rights issue, ex-date: 12 Sep 06
Quality key factors
Valuation key factors
Technicals key factors
 Technical Indicator Scale: Bearish, Mildly Bearish, Sideways, Mildly Bullish, Bullish Turned
 Shareholding Snapshot : Mar 2026
Shareholding Compare (%holding)
Promoters
43.3624
Held by 0 Schemes
Held by 1 FIIs (1.37%)
Payal Agarwal (24.92%)
Anirudh Mohta (1.98%)
22.37%
Quarterly Results Snapshot (Standalone) - Mar'26 - QoQ

QoQ Growth in quarter ended Mar 2026 is 21.45% vs 8.07% in Dec 2025

QoQ Growth in quarter ended Mar 2026 is -17.10% vs 1.43% in Dec 2025
Half Yearly Results Snapshot (Standalone) - Sep'25
Growth in half year ended Sep 2025 is -0.18% vs -14.38% in Sep 2024
Growth in half year ended Sep 2025 is 13.85% vs -45.64% in Sep 2024
Nine Monthly Results Snapshot (Standalone) - Dec'25
YoY Growth in nine months ended Dec 2025 is 4.52% vs -11.31% in Dec 2024
YoY Growth in nine months ended Dec 2025 is 61.82% vs -51.37% in Dec 2024
Annual Results Snapshot (Standalone) - Mar'26
YoY Growth in year ended Mar 2026 is 10.57% vs -9.56% in Mar 2025
YoY Growth in year ended Mar 2026 is 240.69% vs -171.85% in Mar 2025
About GEE Ltd

Company Coordinates


