
Compare Gemstone Invest. with Similar Stocks
Dashboard
Weak Long Term Fundamental Strength with an average Return on Equity (ROE) of 1.09%
- Poor long term growth as Net Sales has grown by an annual rate of 1.99% and Operating profit at 4.23%
Flat results in Mar 26
With ROE of 0.8, it has a Expensive valuation with a 0.4 Price to Book Value
Underperformed the market in the last 1 year
Stock DNA
Diversified Commercial Services
INR 22 Cr (Micro Cap)
54.00
20
0.00%
0.07
0.80%
0.44
Total Returns (Price + Dividend) 
Gemstone Invest. for the last several years.
Risk Adjusted Returns v/s
Returns Beta

News
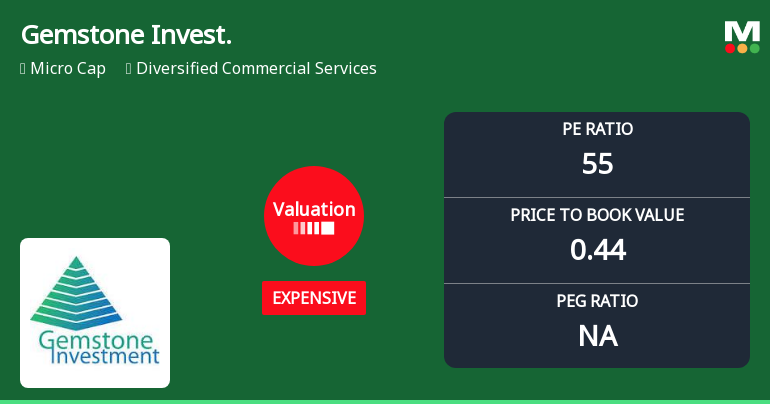
Gemstone Investments Ltd Valuation Shifts Signal Elevated Price Risk
Gemstone Investments Ltd, a micro-cap player in the diversified commercial services sector, has seen its valuation parameters shift notably, raising questions about its price attractiveness relative to historical and peer benchmarks. Despite a modest day gain of 1.27%, the company’s price-to-earnings (P/E) ratio has surged to 54.56, marking a transition from fair to expensive territory and prompting a downgrade in its Mojo Grade to Strong Sell.
Read full news article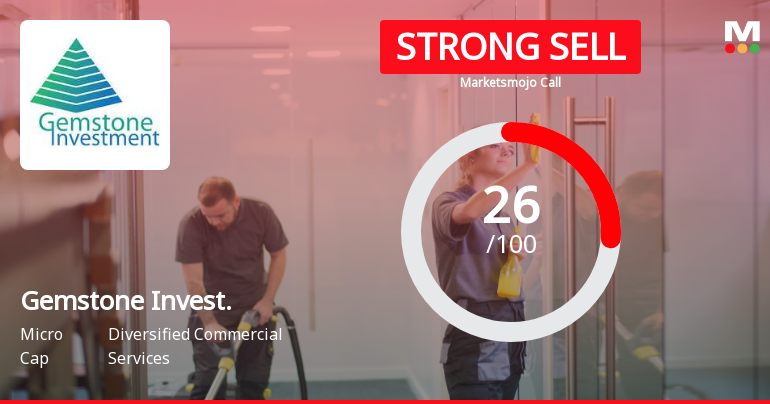
Gemstone Investments Ltd Downgraded to Strong Sell Amid Weak Fundamentals and Valuation Concerns
Gemstone Investments Ltd, a micro-cap player in the diversified commercial services sector, has been downgraded from a Sell to a Strong Sell rating as of 8 June 2026. This revision reflects a combination of flat quarterly financial performance, weak long-term fundamentals, and deteriorating technical indicators, signalling heightened risk for investors amid challenging market conditions.
Read full news article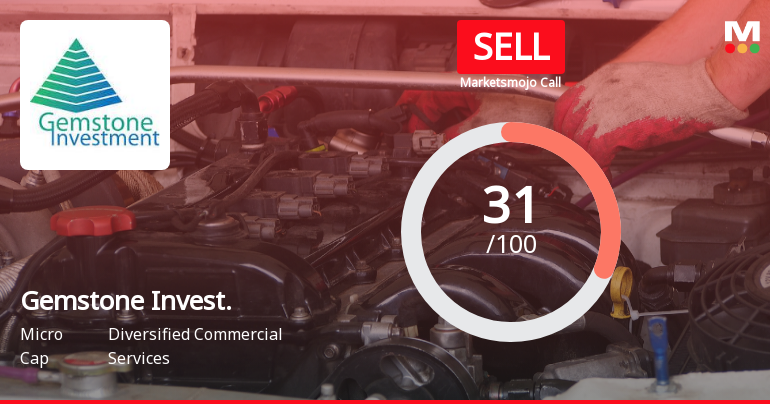
Gemstone Investments Ltd Upgraded to Sell on Valuation Improvement and Financial Trends
Gemstone Investments Ltd has seen its investment rating upgraded from Strong Sell to Sell, driven primarily by a marked improvement in valuation metrics despite ongoing challenges in financial performance and market returns. The revised rating reflects a nuanced assessment across quality, valuation, financial trend, and technical parameters, signalling cautious optimism amid persistent headwinds.
Read full news article Announcements
Board Meeting Outcome for Board Meeting Outcome For Conversion Of Warrants Into Equity Shares.
08-Jun-2026 | Source : BSEConversion of warrants into equity shares through preferential issue.
Announcement under Regulation 30 (LODR)-Conversion of Securities
08-Jun-2026 | Source : BSEConversion of Warrants into Equity Shares.
Conversion Of Warrants Into Equity Shares
04-Jun-2026 | Source : BSEConversion of Warrants of Equity Shares
Corporate Actions

No Upcoming Board Meetings

No Dividend history available

Gemstone Investments Ltd has announced 1:10 stock split, ex-date: 13 Aug 10

No Bonus history available

No Rights history available
Quality key factors
Valuation key factors
Technicals key factors
 Technical Indicator Scale: Bearish, Mildly Bearish, Sideways, Mildly Bullish, Bullish Turned
 Shareholding Snapshot : Mar 2026
Shareholding Compare (%holding)
Non Institution
None
Held by 0 Schemes
Held by 0 FIIs
None
Arcadia Share And Stock Brokers Pvt Ltd-proprietary A/c (5.56%)
69.99%
Quarterly Results Snapshot (Standalone) - Mar'26 - QoQ

QoQ Growth in quarter ended Mar 2026 is 58.62% vs 52.63% in Dec 2025
QoQ Growth in quarter ended Mar 2026 is 244.44% vs -268.75% in Dec 2025
Half Yearly Results Snapshot (Standalone) - Sep'25

Growth in half year ended Sep 2025 is -14.94% vs -13.86% in Sep 2024
Growth in half year ended Sep 2025 is -17.14% vs -49.28% in Sep 2024
Nine Monthly Results Snapshot (Standalone) - Dec'25
YoY Growth in nine months ended Dec 2025 is 48.31% vs -41.45% in Dec 2024
YoY Growth in nine months ended Dec 2025 is -91.67% vs -75.76% in Dec 2024
Annual Results Snapshot (Standalone) - Mar'26
YoY Growth in year ended Mar 2026 is 78.40% vs -40.76% in Mar 2025
YoY Growth in year ended Mar 2026 is 25.00% vs -8.57% in Mar 2025
About Gemstone Investments Ltd

Company Coordinates


