Genesys Intl.

  • Market Cap: Micro Cap
  • Industry: Computers - Software & Consulting
  • ISIN: INE727B01026
  • NSEID: GENESYS
  • BSEID: 506109
INR
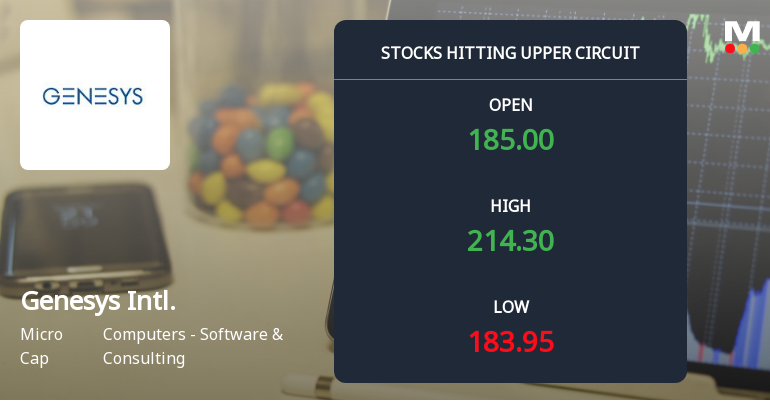
214.30
35.7 (19.99%)
BSENSE

Aug 25, 03:40 PM

BSE+NSE Vol: 44.39 lacs

  • Price Points
  • Score
  • Mojo Parameters
  • Total Return
  • News and Corporate Actions
  • Key factors
  • Shareholding
  • Financials
  • CompanyCV
stock-summaryPrice Point
High/Low

1Day

52 Week

Valuation
Technical
Day's Volume

CASH

44.39 lacs (719.84%) Volume

Shareholding (Jun 2026)

FII

1.53%

Held by 19 FIIs

DII

1.12%

Held by 0 DIIs

Promoter

31.50%

Why is Genesys International Corporation Ltd falling/rising?

25-Aug-2026

As of 24-Aug, Genesys International Corporation Ltd's stock price is currently at 178.60, reflecting a decline of 1.15 (-0.64%) and a significant year-to-date drop of 40.18%. The stock is underperforming compared to the sector and has seen reduced investor interest, contributing to its ongoing bearish trend.

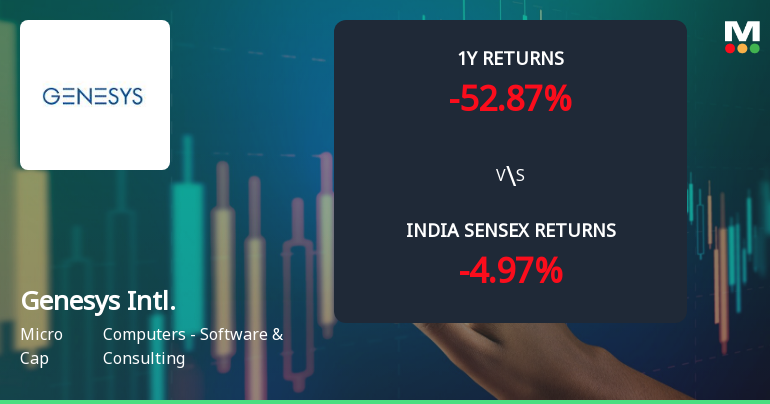
As of 24-Aug, Genesys International Corporation Ltd's stock price is falling, currently at 178.60, reflecting a decrease of 1.15 (-0.64%). This decline is part of a broader trend, as the stock has been underperforming, having lost 3.22% over the last two days. Additionally, the stock has significantly underperformed the sector today by 1.27%. <BR><BR>In terms of longer-term performance, the stock has experienced a substantial decline year-to-date, down 40.18%, and a staggering 56.10% over the past year. This is in stark contrast to the benchmark Sensex, which has only decreased by 9.21% year-to-date and 4.84% over the past year. <BR><BR>The stock is also trading below its moving averages across various time frames, indicating a bearish trend. Furthermore, investor participation has decreased, with delivery volume falling by 57.95% against the 5-day average, suggesting reduced interest from investors. Overall, these factors contribute to the ongoing decline in the stock price of Genesys International Corporation Ltd.

View full answer

Should I buy, sell or hold Genesys International Corporation Ltd?

24-Aug-2026

Who are in the management team of Genesys Intl.?

14-Aug-2026

The management team of Genesys Intl. includes Sajid Malik (Chairman & Managing Director), Saroja Malik (Whole-time Director), Ganapathy Vishwanathan (Non-Executive Director), Ganesh Acharya, Manish Chhaganlal Patel, and Bharti Sinha (all Independent Directors), along with Vineet Chopra (Company Secretary & Compliance Officer).

The management team of Genesys Intl. includes the following members:<BR><BR>1. **Sajid Malik** - Chairman & Managing Director<BR>2. **Saroja Malik** - Whole-time Director<BR>3. **Ganapathy Vishwanathan** - Non-Executive Director<BR>4. **Ganesh Acharya** - Independent Director<BR>5. **Vineet Chopra** - Company Secretary & Compliance Officer<BR>6. **Manish Chhaganlal Patel** - Independent Director<BR>7. **Bharti Sinha** - Independent Director<BR><BR>If you need more information about their roles or the company, feel free to ask!

View full answer

What does Genesys Intl. do?

14-Aug-2026

Genesys International Corporation Ltd provides Geographical Information Services and operates in the micro-cap market. As of March 2026, it reported net sales of 104 Cr and a net profit of 12 Cr, with a market cap of INR 1,411 Cr.

Overview: <BR>Genesys International Corporation Ltd is engaged in providing Geographical Information Services within the Computers - Software & Consulting industry and operates in the micro-cap market.<BR><BR>History: <BR>Genesys International Corporation Limited was incorporated on 28 January, 1983. The latest quarterly results reported are for March 2026, showing net sales and profit figures.<BR><BR>Financial Snapshot: <BR>Net Sales: 104 Cr (Quarterly Results - Mar 2026) <BR>Net Profit: 12 Cr (Quarterly Results - Mar 2026) <BR>Market Cap: INR 1,411 Cr (Micro Cap)<BR><BR>Key Metrics: <BR>P/E: 40.00 <BR>Industry P/E: 22 <BR>Dividend Yield: 0.00% <BR>Debt-Equity: 0.10 <BR>Return on Equity: 4.99% <BR>Price to Book: 1.99 <BR><BR>Contact Details: <BR>Address: 73-A SDF III, SEEPZ Andheri (East) Mumbai Maharashtra : 400096 <BR>Tel: 91-022-44884488 <BR>Email: investors@igenesys.com <BR>Website: http://www.igenesys.com

View full answer

Who are the peers of the Genesys Intl.?

14-Aug-2026

Peers of Genesys Intl. include InfoBeans Tech., Ceinsys Tech., Dynacons Sys., IZMO, NINtec Systems, Expleo Solutions, Orient Tech., and TAC Infosec. Genesys Intl. has average management risk and a 1-year return of -49.66%, better than Ceinsys Tech. but lower than IZMO's 132.95%.

Peers: The peers of Genesys Intl. are InfoBeans Tech., Ceinsys Tech, Dynacons Sys., IZMO, NINtec Systems, Expleo Solutions, Orient Tech., and TAC Infosec.<BR><BR>Quality Snapshot: Excellent management risk is observed at Ceinsys Tech, Dynacons Sys., NINtec Systems, Expleo Solutions, and TAC Infosec, while Average management risk is found at InfoBeans Tech., Genesys Intl., IZMO, and Orient Tech. Good growth is noted at InfoBeans Tech., Genesys Intl., Dynacons Sys., IZMO, and the rest, while Excellent growth is seen at Ceinsys Tech., NINtec Systems, and TAC Infosec. Excellent capital structure is present at InfoBeans Tech., Ceinsys Tech., Genesys Intl., IZMO, NINtec Systems, Expleo Solutions, and TAC Infosec, while Good capital structure is found at Dynacons Sys. and Average capital structure at Orient Tech.<BR><BR>Return Snapshot: The peer with the highest 1-year return is IZMO at 132.95%, while the lowest is Ceinsys Tech at -52.61%. Genesys Intl.'s 1-year return of -49.66% is lower than that of IZMO but higher than Ceinsys Tech. Additionally, Expleo Solutions, Orient Tech., and TAC Infosec have negative six-month returns.

View full answer

Are Genesys International Corporation Ltd latest results good or bad?

14-Aug-2026

Genesys International Corporation Ltd's latest results show strong quarter-on-quarter growth with a 1,000% increase in net profit and 37.53% revenue growth, but year-on-year comparisons reveal a 34.78% decline in net profit and a significant drop in operating margins. Overall, while recent performance is positive, the company faces serious challenges, including a 65.09% stock decline over the past year and reduced investor confidence.

Genesys International Corporation Ltd's latest results present a mixed picture. On one hand, the company reported a significant quarter-on-quarter increase in net profit, soaring by over 1,000% to ₹12.36 crores, and a robust revenue growth of 37.53% to ₹104.22 crores in Q4 FY26. This marks the highest quarterly revenue in its recent history and indicates some recovery in project execution and order book conversion.<BR><BR>However, when viewed year-on-year, the situation is less favorable. The net profit has declined by 34.78%, and the operating margin has sharply contracted from 52.87% to 32.73%. This erosion in margins raises concerns about the sustainability of profitability, reflecting rising costs and competitive pressures in the geographical information services sector.<BR><BR>Additionally, the stock has faced severe pressure, plunging 65.09% over the past year, which highlights broader investor concerns about the company's financial health and operational challenges. The decline in institutional holdings, particularly from foreign investors, further underscores a lack of confidence in the company's growth prospects.<BR><BR>In summary, while there are positive signs in terms of recent revenue and profit growth, the overall financial health and market performance of Genesys International suggest significant challenges that investors should carefully consider.

View full answer

How big is Genesys Intl.?

14-Aug-2026

As of 14th August, Genesys International Corporation Ltd has a market capitalization of 1,215.26 Cr and reported net sales of 327.82 Cr and net profit of 32.57 Cr over the latest four quarters.

As of 14th August, <BR><BR>Market Cap: Genesys International Corporation Ltd has a market capitalization of 1,215.26 Cr, classified as a Micro Cap.<BR><BR>Recent Quarterly Performance: The sum of Net Sales for the latest 4 quarters is 327.82 Cr, while the sum of Net Profit for the same period is 32.57 Cr.<BR><BR>Balance Sheet Snapshot: The reporting period is March 2025, with Shareholder's Funds amounting to 555.54 Cr and Total Assets valued at 766.65 Cr.

View full answer

When is the next results date for Genesys International Corporation Ltd?

06-Feb-2026

The next results date for Genesys International Corporation Ltd is 12 February 2026.

The next results date for Genesys International Corporation Ltd is scheduled for 12 February 2026.

View full answer

Is Genesys Intl. overvalued or undervalued?

17-Nov-2025

As of November 14, 2025, Genesys International is fairly valued with a PE ratio of 33.83, but its recent underperformance of -48.00% year-to-date compared to the Sensex's 8.22% suggests caution for potential investors.

As of 14 November 2025, the valuation grade for Genesys International has moved from expensive to fair. The company is currently fairly valued based on its financial metrics. Key ratios include a PE ratio of 33.83, an EV to EBITDA of 13.77, and a ROCE of 13.20%. <BR><BR>In comparison to its peers, TCS has a more attractive PE ratio of 22.34, while Infosys also maintains a fair valuation with a PE of 22.19. Notably, Genesys has underperformed relative to the Sensex, with a year-to-date return of -48.00% compared to the Sensex's 8.22%. Overall, while Genesys International is fairly valued, its recent stock performance suggests caution for potential investors.

View full answer

How has been the historical performance of Genesys Intl.?

14-Nov-2025

Genesys Intl. has shown significant growth from March 2023 to March 2025, with net sales increasing from 181.13 Cr to 311.03 Cr, and profit after tax rising from 14.93 Cr to 56.10 Cr. Despite a negative cash flow trend in 2025, the company has demonstrated a strong recovery and improved profitability.

Answer:<BR>The historical performance of Genesys Intl. shows significant growth in net sales and profitability over the years, particularly from March 2023 to March 2025.<BR><BR>Breakdown:<BR>Genesys Intl. has experienced a remarkable increase in net sales, rising from 181.13 Cr in March 2023 to 311.03 Cr in March 2025. This growth is reflected in total operating income, which also rose from 181.13 Cr to 311.03 Cr during the same period. The company's operating profit (PBDIT) saw a substantial improvement, moving from 64.87 Cr in March 2023 to 146.49 Cr in March 2025, indicating a strong operating profit margin increase from 32.23% to 45.7%. Profit before tax improved significantly from 25.00 Cr in March 2023 to 82.68 Cr in March 2025, leading to a profit after tax of 56.10 Cr in March 2025, up from 14.93 Cr in March 2023. The earnings per share (EPS) also surged from 5.05 to 14.13 during this period. On the balance sheet, total assets increased from 478.72 Cr in March 2023 to 766.65 Cr in March 2025, while total liabilities rose from 478.72 Cr to 766.65 Cr, reflecting the company's growth strategy. Cash flow from operating activities showed a negative trend, with a cash outflow of 52.00 Cr in March 2025, contrasting with a positive inflow of 19.00 Cr in March 2024. Overall, Genesys Intl. has demonstrated a strong recovery and growth trajectory in its financial performance over the past few years.

View full answer

Is Genesys Intl. technically bullish or bearish?

21-Oct-2025

As of 20 October 2025, Genesys Intl. has shifted to a bearish trend with moderate strength, indicated by bearish MACD, Bollinger Bands, KST, and moving averages, while the RSI shows no momentum.

As of 20 October 2025, the technical trend for Genesys Intl. has changed from mildly bearish to bearish. The current technical stance is bearish with a moderate strength. Key indicators driving this include a bearish MACD on the weekly chart, bearish signals from Bollinger Bands and KST on both weekly and monthly time frames, and bearish moving averages on the daily chart. The RSI shows no signal, indicating a lack of momentum in either direction. Overall, the technical outlook suggests a continued downward pressure on the stock.

View full answer

Who are the top shareholders of the Genesys Intl.?

17-Jul-2025

The top shareholders of Genesys Intl. include Kilam Holdings Ltd. with 16.05%, followed by 33 Foreign Institutional Investors holding 6.29%, and public shareholder Sunita O Hemrajani with 5.51%. Individual investors collectively own 43.55%, while no mutual funds hold shares in the company.

The top shareholders of Genesys Intl. include Kilam Holdings Ltd, which holds the highest promoter stake at 16.05%. Additionally, the company has 33 Foreign Institutional Investors (FIIs) collectively holding 6.29%. The highest public shareholder is Sunita O Hemrajani, with a stake of 5.51%. Individual investors have a significant presence, holding 43.55% of the shares. Notably, there are no mutual funds currently holding shares in the company.

View full answer

Has Genesys Intl. declared dividend?

06-Jun-2025

Genesys International Corporation Ltd has declared a 2% dividend, amounting to 0.1 per share, with an ex-date of September 18, 2019. However, the dividend yield is 0%, as it does not significantly contribute to total returns, which have been primarily driven by substantial price increases over various periods.

Genesys International Corporation Ltd has declared a 2% dividend.<BR><BR>Dividend Details:<BR>- Percentage announced: 2%<BR>- Amount per share: 0.1<BR>- Ex-date: 18 Sep 19<BR><BR>Dividend Yield: 0%<BR><BR>Total Returns by Period:<BR>In the past 6 months, the price return was -28.2%, the dividend return was 0%, resulting in a total return of -28.2%.<BR><BR>Over the 1-year period, the price return was 40.56%, with a dividend return of 0%, leading to a total return of 40.56%.<BR><BR>For the 2-year period, the price return was 109.24%, the dividend return was 0%, which resulted in a total return of 109.24%.<BR><BR>In the 3-year period, the price return was 50.4%, with a dividend return of 0%, culminating in a total return of 50.4%.<BR><BR>Over the 4-year period, the price return was 578.25%, the dividend return was 0%, leading to a total return of 578.25%.<BR><BR>Finally, in the 5-year period, the price return was 2128.39%, with a dividend return of 0%, resulting in a total return of 2128.39%.<BR><BR>Overall, while Genesys International has declared a dividend, the dividend yield remains at 0%, indicating that the dividend does not significantly contribute to total returns. The company has shown substantial price returns over various periods, particularly in the long term.

View full answer
iScoreScore
Click here to find our call on this stock
Strong Sell
Sell
Hold
Buy
Strong Buy

Dashboard

1

The company has declared Negative results for the last 3 consecutive quarters

  • PAT(Latest six months) At Rs 17.69 cr has Grown at -32.14%
  • ROCE(HY) Lowest at 7.31%
  • PBT LESS OI(Q) At Rs 6.56 cr has Fallen at -17.7% (vs previous 4Q average)
2

Falling Participation by Institutional Investors

3

Underperformed the market in the last 1 year

stock-summaryMojo Parameters

Mojo Parameters

Loading Valuation Snapshot...

Stock DNA

stock-summary
Industry

Computers - Software & Consulting

stock-summary
Market cap

INR 1,433 Cr (Micro Cap)

stock-summary
P/E

36.00

stock-summary
Industry P/E

21

stock-summary
Dividend Yield

0.00%

stock-summary
Debt Equity

0.10

stock-summary
Return on Equity

4.99%

stock-summary
Price to Book

1.69

Revenue and Profits:
Net Sales:
81 Cr
(Quarterly Results - Jun 2026)
Net Profit:
5 Cr
stock-summaryTotal Returns
Total Returns (Price + Dividend) stock-summary
Dividend Yield (0%)
TimePeriod
Price Return
Dividend Return
Total Return
3 Months
23.46%
0%
23.46%
6 Months
4.22%
0%
4.22%
1 Year
-47.18%
0%
-47.18%
2 Years
-56.22%
0%
-56.22%
3 Years
-1.48%
0%
-1.48%
4 Years
-47.18%
0%
-47.18%
5 Years
140.91%
0%
140.91%

Latest dividend: 0.06819 per share ex-dividend date: Sep-18-2019

Risk Adjusted Returns v/s stock-summary
Returns Beta
Icon
Beta has not been calculated since enough price history is not available
stock-summaryNews & Corporate Actions

News

Announcements stock-summary

Press Release

17-Aug-2026 | Source : BSE

Please find attached a copy of press release titled " Genesys International appoints Nikhil Alulkar as Chief Executive officer"

Announcement under Regulation 30 (LODR)-Newspaper Publication

16-Aug-2026 | Source : BSE

Please find enclosed a copy of Newspaper Publication of Un-audited Financial Results (Standalone and Consolidated) of the Company for the quarter ended June 30 2026 as published in the newspaper - The Free Press Journal (English) and Navshakti (Marathi)

Announcement under Regulation 30 (LODR)-Monitoring Agency Report

14-Aug-2026 | Source : BSE

Monitoring Agency Report for the quarter ended June 30 2026

Corporate Actions stock-summary

stock-summary
BOARD MEETING

No Upcoming Board Meetings

stock-summary
DIVIDEND

Genesys International Corporation Ltd has declared 2% dividend, ex-date: 18 Sep 19

stock-summary
SPLITS

Genesys International Corporation Ltd has announced 5:10 stock split, ex-date: 23 Jun 10

stock-summary
BONUS

No Bonus history available

stock-summary
RIGHTS

Genesys International Corporation Ltd has announced 3:5 rights issue, ex-date: 06 Aug 26

stock-summaryKey Factors

Quality key factors stock-summary

Factor
Value
Sales Growth (5y)
30.43%
EBIT Growth (5y)
77.28%
EBIT to Interest (avg)
7.24
Debt to EBITDA (avg)
0.49
Net Debt to Equity (avg)
0.10
Sales to Capital Employed (avg)
0.43
Tax Ratio
27.08%
Dividend Payout Ratio
0
Pledged Shares
16.00%
Institutional Holding
2.65%
ROCE (avg)
4.91%
ROE (avg)
10.58%

Valuation key factors

Factor
Value
P/E Ratio
36
Industry P/E
21
Price to Book Value
1.69
EV to EBIT
31.40
EV to EBITDA
11.64
EV to Capital Employed
1.63
EV to Sales
3.71
PEG Ratio
NA
Dividend Yield
NA
ROCE (Latest)
5.75%
ROE (Latest)
4.99%

Technicals key factors

Indicator
Weekly
Monthly
MACD
Bearish
Bearish
RSI
No Signal
No Signal
Bollinger Bands
Bearish
Bearish
Moving Averages
Bearish (Daily)
KST
Bullish
Bearish
Dow Theory
No Trend
Mildly Bullish
OBV
No Trend
Bullish
stock-summary Technical Indicator Scale: Bearish, Mildly Bearish, Sideways, Mildly Bullish, Bullish  Turned 
stock-summaryShareholding
Shareholding Snapshot : Jun 2026stock-summary
Shareholding Compare (%holding) stock-summary
Majority shareholders

Non Institution

Pledged Promoter Holdings

16.0017

Mutual Funds

Held by 0 Schemes

FIIs

Held by 19 FIIs (1.53%)

Promoter with highest holding

Kilam Holdings Ltd (15.29%)

Highest Public shareholder

Sunita O Hemrajani (5.17%)

Individual Investors Holdings

49.05%

stock-summaryFinancial
[
  {
    "link": "quarterly",
    "btn_text": "All Quarterly Results",
    "header": "Quarterly Results Snapshot (Consolidated) - Jun'26 - QoQ",
    "rhs": [
      {
        "prefix": "Net Sales ",
        "suffix": "QoQ Growth in quarter ended Jun 2026 is -21.93% vs 37.53% in Mar 2026",
        "dir": -1
      },
      {
        "prefix": "Consolidated Net Profit ",
        "suffix": "QoQ Growth in quarter ended Jun 2026 is -56.88% vs 1,033.94% in Mar 2026",
        "dir": -1
      }
    ],
    "table": {
      "header": [
        "Jun'26",
        "Mar'26",
        "Change(%)"
      ],
      "body": [
        {
          "field": "Net Sales",
          "val1": "81.36",
          "val2": "104.22",
          "chgp": "-21.93%",
          "chgp_class": "negative"
        },
        {
          "field": "Operating Profit (PBDIT) excl Other Income",
          "val1": "28.13",
          "val2": "34.11",
          "chgp": "-17.53%",
          "chgp_class": "negative"
        },
        {
          "field": "Interest",
          "val1": "3.14",
          "val2": "3.35",
          "chgp": "-6.27%",
          "chgp_class": "positive"
        },
        {
          "field": "Exceptional Items",
          "val1": "0.00",
          "val2": "0.00",
          "chgp": "",
          "chgp_class": "neutral"
        },
        {
          "field": "Consolidate Net Profit",
          "val1": "5.33",
          "val2": "12.36",
          "chgp": "-56.88%",
          "chgp_class": "negative"
        },
        {
          "field": "Operating Profit Margin (Excl OI)",
          "val1": "34.57%",
          "val2": "32.73%",
          "chgp": "1.84%",
          "chgp_class": "positive"
        }
      ]
    }
  },
  {
    "link": "half-yearly",
    "btn_text": "All Half Yearly Results",
    "header": "Half Yearly Results Snapshot (Consolidated) - Sep'25",
    "rhs": [
      {
        "prefix": "Net Sales ",
        "suffix": " Growth in half year ended Sep 2025 is 15.68% vs 88.63% in Sep 2024",
        "dir": -1
      },
      {
        "prefix": "Consolidated Net Profit ",
        "suffix": " Growth in half year ended Sep 2025 is 15.11% vs 292.47% in Sep 2024",
        "dir": -1
      }
    ],
    "table": {
      "header": [
        "Sep'25",
        "Sep'24",
        "Change(%)"
      ],
      "body": [
        {
          "field": "Net Sales",
          "val1": "147.81",
          "val2": "127.78",
          "chgp": "15.68%",
          "chgp_class": "positive"
        },
        {
          "field": "Operating Profit (PBDIT) excl Other Income",
          "val1": "59.49",
          "val2": "49.79",
          "chgp": "19.48%",
          "chgp_class": "positive"
        },
        {
          "field": "Interest",
          "val1": "6.29",
          "val2": "3.12",
          "chgp": "101.60%",
          "chgp_class": "negative"
        },
        {
          "field": "Exceptional Items",
          "val1": "0.00",
          "val2": "0.00",
          "chgp": "",
          "chgp_class": "neutral"
        },
        {
          "field": "Consolidate Net Profit",
          "val1": "19.12",
          "val2": "16.61",
          "chgp": "15.11%",
          "chgp_class": "positive"
        },
        {
          "field": "Operating Profit Margin (Excl OI)",
          "val1": "40.25%",
          "val2": "38.97%",
          "chgp": "1.28%",
          "chgp_class": "positive"
        }
      ]
    }
  },
  {
    "link": "nine-monthly",
    "btn_text": "All Nine Monthly Results",
    "header": "Nine Monthly Results Snapshot (Consolidated) - Dec'25",
    "rhs": [
      {
        "prefix": "Net Sales ",
        "suffix": "YoY Growth in nine months ended Dec 2025 is 3.10% vs 70.66% in Dec 2024",
        "dir": -1
      },
      {
        "prefix": "Consolidated Net Profit ",
        "suffix": "YoY Growth in nine months ended Dec 2025 is -45.77% vs 415.49% in Dec 2024",
        "dir": -1
      }
    ],
    "table": {
      "header": [
        "Dec'25",
        "Dec'24",
        "Change(%)"
      ],
      "body": [
        {
          "field": "Net Sales",
          "val1": "223.59",
          "val2": "216.87",
          "chgp": "3.10%",
          "chgp_class": "positive"
        },
        {
          "field": "Operating Profit (PBDIT) excl Other Income",
          "val1": "75.24",
          "val2": "92.35",
          "chgp": "-18.53%",
          "chgp_class": "negative"
        },
        {
          "field": "Interest",
          "val1": "9.13",
          "val2": "5.70",
          "chgp": "60.18%",
          "chgp_class": "negative"
        },
        {
          "field": "Exceptional Items",
          "val1": "-5.10",
          "val2": "0.00",
          "chgp": "",
          "chgp_class": "neutral"
        },
        {
          "field": "Consolidate Net Profit",
          "val1": "20.21",
          "val2": "37.27",
          "chgp": "-45.77%",
          "chgp_class": "negative"
        },
        {
          "field": "Operating Profit Margin (Excl OI)",
          "val1": "33.65%",
          "val2": "42.58%",
          "chgp": "-8.93%",
          "chgp_class": "negative"
        }
      ]
    }
  },
  {
    "link": "annual",
    "btn_text": "All Annual Results",
    "header": "Annual Results Snapshot (Consolidated) - Mar'26",
    "rhs": [
      {
        "prefix": "Net Sales ",
        "suffix": "YoY Growth in year ended Mar 2026 is 5.39% vs 56.90% in Mar 2025",
        "dir": -1
      },
      {
        "prefix": "Consolidated Net Profit ",
        "suffix": "YoY Growth in year ended Mar 2026 is -42.05% vs 154.73% in Mar 2025",
        "dir": -1
      }
    ],
    "table": {
      "header": [
        "Mar'26",
        "Mar'25",
        "Change(%)"
      ],
      "body": [
        {
          "field": "Net Sales",
          "val1": "327.81",
          "val2": "311.03",
          "chgp": "5.39%",
          "chgp_class": "positive"
        },
        {
          "field": "Operating Profit (PBDIT) excl Other Income",
          "val1": "109.35",
          "val2": "142.13",
          "chgp": "-23.06%",
          "chgp_class": "negative"
        },
        {
          "field": "Interest",
          "val1": "12.48",
          "val2": "8.78",
          "chgp": "42.14%",
          "chgp_class": "negative"
        },
        {
          "field": "Exceptional Items",
          "val1": "-5.10",
          "val2": "0.00",
          "chgp": "",
          "chgp_class": "neutral"
        },
        {
          "field": "Consolidate Net Profit",
          "val1": "32.58",
          "val2": "56.22",
          "chgp": "-42.05%",
          "chgp_class": "negative"
        },
        {
          "field": "Operating Profit Margin (Excl OI)",
          "val1": "33.36%",
          "val2": "45.70%",
          "chgp": "-12.34%",
          "chgp_class": "negative"
        }
      ]
    }
  }
]

Quarterly Results Snapshot (Consolidated) - Jun'26 - QoQstock-summary

Jun'26
Mar'26
Change(%)
Net Sales
81.36
104.22
-21.93%
Operating Profit (PBDIT) excl Other Income
28.13
34.11
-17.53%
Interest
3.14
3.35
-6.27%
Exceptional Items
0.00
0.00
Consolidate Net Profit
5.33
12.36
-56.88%
Operating Profit Margin (Excl OI)
34.57%
32.73%
1.84%
Values in Rs Cr.
Direction Arrows
Net Sales

QoQ Growth in quarter ended Jun 2026 is -21.93% vs 37.53% in Mar 2026

Direction Arrows
Consolidated Net Profit

QoQ Growth in quarter ended Jun 2026 is -56.88% vs 1,033.94% in Mar 2026

Half Yearly Results Snapshot (Consolidated) - Sep'25stock-summary

Sep'25
Sep'24
Change(%)
Net Sales
147.81
127.78
15.68%
Operating Profit (PBDIT) excl Other Income
59.49
49.79
19.48%
Interest
6.29
3.12
101.60%
Exceptional Items
0.00
0.00
Consolidate Net Profit
19.12
16.61
15.11%
Operating Profit Margin (Excl OI)
40.25%
38.97%
1.28%
Values in Rs Cr.
Direction Arrows
Net Sales

Growth in half year ended Sep 2025 is 15.68% vs 88.63% in Sep 2024

Direction Arrows
Consolidated Net Profit

Growth in half year ended Sep 2025 is 15.11% vs 292.47% in Sep 2024

Nine Monthly Results Snapshot (Consolidated) - Dec'25stock-summary

Dec'25
Dec'24
Change(%)
Net Sales
223.59
216.87
3.10%
Operating Profit (PBDIT) excl Other Income
75.24
92.35
-18.53%
Interest
9.13
5.70
60.18%
Exceptional Items
-5.10
0.00
Consolidate Net Profit
20.21
37.27
-45.77%
Operating Profit Margin (Excl OI)
33.65%
42.58%
-8.93%
Values in Rs Cr.
Direction Arrows
Net Sales

YoY Growth in nine months ended Dec 2025 is 3.10% vs 70.66% in Dec 2024

Direction Arrows
Consolidated Net Profit

YoY Growth in nine months ended Dec 2025 is -45.77% vs 415.49% in Dec 2024

Annual Results Snapshot (Consolidated) - Mar'26stock-summary

Mar'26
Mar'25
Change(%)
Net Sales
327.81
311.03
5.39%
Operating Profit (PBDIT) excl Other Income
109.35
142.13
-23.06%
Interest
12.48
8.78
42.14%
Exceptional Items
-5.10
0.00
Consolidate Net Profit
32.58
56.22
-42.05%
Operating Profit Margin (Excl OI)
33.36%
45.70%
-12.34%
Values in Rs Cr.
Direction Arrows
Net Sales

YoY Growth in year ended Mar 2026 is 5.39% vs 56.90% in Mar 2025

Direction Arrows
Consolidated Net Profit

YoY Growth in year ended Mar 2026 is -42.05% vs 154.73% in Mar 2025

stock-summaryCompany CV
About Genesys International Corporation Ltd stock-summary
stock-summary
Genesys International Corporation Ltd
Micro Cap
Computers - Software & Consulting
Genesys International Corporation Limited (GICL) was incorporated on 28 January, 1983. Presently, the Company is engaged in providing Geographical Information Services comprising of photogrammetry, remote sensing, cartography, data conversion, state of the art terrestrial and 3D geo-content including location navigation mapping and other computer based related services.
Company Coordinates stock-summary
Company Details
73-A SDF III, SEEPZ Andheri (East) Mumbai Maharashtra : 400096
stock-summary
Tel: 91-022-44884488
stock-summary
investors@igenesys.com
Registrar Details
Bigshare Services Pvt Ltd , E-2 , Ansa Industrial Estate, Saki Vihar Road, Saki Naka, Andheri (E), Mumbai