
Compare Genpharmasec with Similar Stocks
Dashboard
Weak Long Term Fundamental Strength with a -7.62% CAGR growth in Operating Profits over the last 5 years
- Low ability to service debt as the company has a high Debt to EBITDA ratio of 3.57 times
- The company has been able to generate a Return on Equity (avg) of 1.44% signifying low profitability per unit of shareholders funds
Risky - Negative Operating Profits
Underperformed the market in the last 1 year
Stock DNA
Trading & Distributors
INR 62 Cr (Micro Cap)
140.00
21
0.00%
0.38
0.66%
0.93
Total Returns (Price + Dividend) 
Genpharmasec for the last several years.
Risk Adjusted Returns v/s
Returns Beta

News

Genpharmasec Ltd is Rated Strong Sell
Genpharmasec Ltd is rated Strong Sell by MarketsMOJO, with this rating last updated on 22 May 2025. However, the analysis and financial metrics presented here reflect the company’s current position as of 29 May 2026, providing investors with an up-to-date view of the stock’s fundamentals, valuation, financial trend, and technical outlook.
Read full news articleAre Genpharmasec Ltd latest results good or bad?
Genpharmasec Ltd's latest financial results for Q4 FY26 present a complex picture of operational performance. The company achieved a record net sales figure of ₹55.43 crores, reflecting a substantial year-on-year growth of 295.65% from ₹14.01 crores in Q4 FY25 and a sequential increase of 39.17% from the previous quarter. This growth indicates successful expansion in its trading and distribution segment. However, the profitability aspect raises concerns. The consolidated net profit for the quarter was ₹1.23 crores, which represents a significant year-on-year decline of 555.56%. The operating profit margin, excluding other income, was recorded at 3.61%, an improvement from the negative margin of -7.14% in the same quarter last year, but still below the 7.81% margin achieved in the previous quarter. This suggests that while sales have surged, the company struggles to convert this revenue into sustainable ope...
Read full news article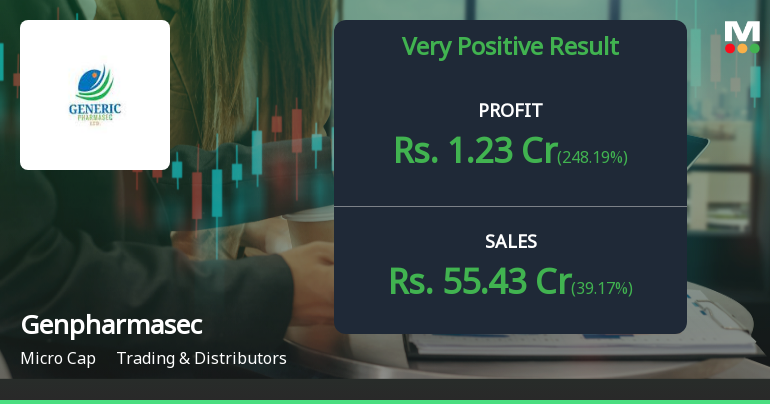
Genpharmasec Q4 FY26: Strong Revenue Surge Masks Profitability Concerns
Genpharmasec Limited, a micro-cap trading and distribution company with a market capitalisation of ₹68.00 crores, reported its fourth quarter results for FY26 (Mar'26) with a consolidated net profit of ₹1.23 crores, representing a dramatic decline of 555.56% year-on-year from a loss of ₹0.27 crores in Mar'25. Despite impressive top-line expansion with revenues surging 295.65% YoY to ₹55.43 crores, the company continues to grapple with profitability challenges and structural concerns that have kept its stock under pressure, currently trading at ₹1.22 after a modest 4.27% gain on result day.
Read full news article Announcements
Compliances-Reg.24(A)-Annual Secretarial Compliance
27-May-2026 | Source : BSEAnnual Secretarial Compliance Report for the year ended March 31 2026.
Announcement under Regulation 30 (LODR)-Newspaper Publication
23-May-2026 | Source : BSENewspaper Publication of Audited Financial Result for the quarter and year ended 31st March 2026.
Statement Of Deviation Or Variation In The Use Of Proceeds Of Rights Issue For The Quarter Ended 31St March 2026.
21-May-2026 | Source : BSEStatement of deviation or variation in the use of proceeds of Rights issue for the Quarter ended 31st March 2026.
Corporate Actions

No Upcoming Board Meetings

No Dividend history available

Genpharmasec Ltd has announced 1:10 stock split, ex-date: 11 Apr 19

No Bonus history available

Genpharmasec Ltd has announced 1:1 rights issue, ex-date: 09 Jan 24
Quality key factors
Valuation key factors
Technicals key factors
 Technical Indicator Scale: Bearish, Mildly Bearish, Sideways, Mildly Bullish, Bullish Turned
 Shareholding Snapshot : Mar 2026
Shareholding Compare (%holding)
Non Institution
None
Held by 0 Schemes
Held by 0 FIIs
Sneha Sadhwani (16.8%)
Rushabh Sevantilal Sanghavi (4.7%)
61.86%
Quarterly Results Snapshot (Consolidated) - Mar'26 - QoQ

QoQ Growth in quarter ended Mar 2026 is 39.17% vs 22.03% in Dec 2025
QoQ Growth in quarter ended Mar 2026 is 248.19% vs 29.66% in Dec 2025
Half Yearly Results Snapshot (Consolidated) - Sep'25
Growth in half year ended Sep 2025 is 297.86% vs -18.74% in Sep 2024

Growth in half year ended Sep 2025 is -96.12% vs 3,333.33% in Sep 2024
Nine Monthly Results Snapshot (Consolidated) - Dec'25
YoY Growth in nine months ended Dec 2025 is 328.77% vs -2.43% in Dec 2024
YoY Growth in nine months ended Dec 2025 is -144.13% vs 1,888.89% in Dec 2024
Annual Results Snapshot (Consolidated) - Mar'26
YoY Growth in year ended Mar 2026 is 315.01% vs 10.88% in Mar 2025
YoY Growth in year ended Mar 2026 is 2.56% vs 1,017.65% in Mar 2025
About Genpharmasec Ltd

Company Coordinates


