
Compare Genus Power with Similar Stocks
Dashboard
Strong ability to service debt as the company has a low Debt to EBITDA ratio of 2.52 times
Healthy long term growth as Net Sales has grown by an annual rate of 50.87% and Operating profit at 60.93%
With a growth in Net Sales of 36.96%, the company declared Very Positive results in Mar 26
With ROCE of 22.9, it has a Attractive valuation with a 2.9 Enterprise value to Capital Employed
69.4% of Promoter Shares are Pledged
Stock DNA
Other Electrical Equipment
INR 9,524 Cr (Small Cap)
16.00
51
0.00%
0.69
26.71%
4.23
Total Returns (Price + Dividend) 
Latest dividend: 0.6 per share ex-dividend date: Sep-23-2024
Risk Adjusted Returns v/s
Returns Beta

News

Genus Power Infrastructures Ltd is Rated Hold
Genus Power Infrastructures Ltd is rated 'Hold' by MarketsMOJO, with this rating last updated on 14 February 2026. However, the analysis and financial metrics discussed here reflect the stock's current position as of 08 June 2026, providing investors with an up-to-date perspective on the company’s performance and outlook.
Read full news article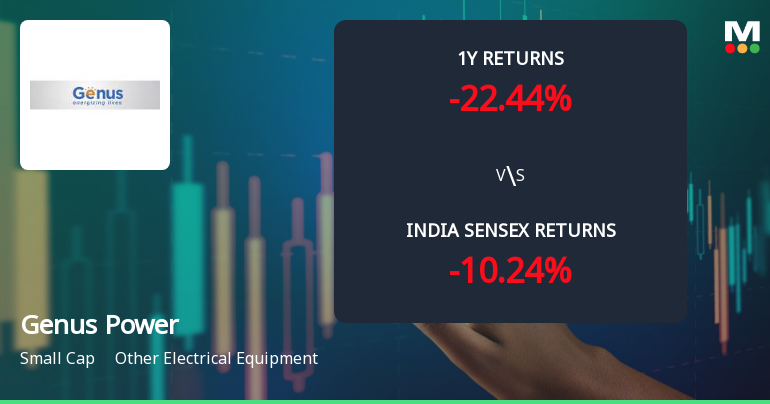
Genus Power Infrastructures Ltd Technical Momentum Shifts Amid Mixed Market Signals
Genus Power Infrastructures Ltd has experienced a notable shift in its technical momentum, transitioning from a sideways trend to a mildly bearish stance. Despite a recent downgrade in its technical trend, the stock exhibits a complex interplay of bullish and bearish signals across key indicators such as MACD, RSI, Bollinger Bands, and moving averages, reflecting a nuanced outlook for investors.
Read full news article
Genus Power Infrastructures Ltd is Rated Hold
Genus Power Infrastructures Ltd is rated 'Hold' by MarketsMOJO, with this rating last updated on 14 February 2026. However, the analysis and financial metrics discussed here reflect the stock's current position as of 08 June 2026, providing investors with an up-to-date view of the company’s fundamentals, returns, and market standing.
Read full news article Announcements
Announcement under Regulation 30 (LODR)-Analyst / Investor Meet - Intimation
03-Jun-2026 | Source : BSEIntimation of Schedule of Analyst / Institutional Investor meeting
Announcement under Regulation 30 (LODR)-Analyst / Investor Meet - Intimation
01-Jun-2026 | Source : BSEIntimation of Schedule of Analyst / Institutional Investor meet
Announcement under Regulation 30 (LODR)-Earnings Call Transcript
26-May-2026 | Source : BSETranscript of Earnings call held on May 19 2026.
Corporate Actions

No Upcoming Board Meetings

Genus Power Infrastructures Ltd has declared 60% dividend, ex-date: 23 Sep 24

Genus Power Infrastructures Ltd has announced 1:10 stock split, ex-date: 22 Oct 10

No Bonus history available

No Rights history available
Quality key factors
Valuation key factors
Technicals key factors
 Technical Indicator Scale: Bearish, Mildly Bearish, Sideways, Mildly Bullish, Bullish Turned
 Shareholding Snapshot : Mar 2026
Shareholding Compare (%holding)
Promoters
69.4042
Held by 2 Schemes (2.92%)
Held by 94 FIIs (18.9%)
Hi - Print Electromack Private Limited (15.55%)
Chiswick Investment Pte Ltd (15.11%)
31.01%
Quarterly Results Snapshot (Consolidated) - Mar'26 - QoQ

QoQ Growth in quarter ended Mar 2026 is 36.96% vs -2.32% in Dec 2025
QoQ Growth in quarter ended Mar 2026 is 22.48% vs -1.91% in Dec 2025
Half Yearly Results Snapshot (Consolidated) - Sep'25
Growth in half year ended Sep 2025 is 132.11% vs 73.25% in Sep 2024
Growth in half year ended Sep 2025 is 113.30% vs 81.91% in Sep 2024
Nine Monthly Results Snapshot (Consolidated) - Dec'25
YoY Growth in nine months ended Dec 2025 is 113.51% vs 93.02% in Dec 2024

YoY Growth in nine months ended Dec 2025 is 123.61% vs 201.78% in Dec 2024
Annual Results Snapshot (Consolidated) - Mar'26
YoY Growth in year ended Mar 2026 is 94.55% vs 103.40% in Mar 2025
YoY Growth in year ended Mar 2026 is 90.22% vs 259.27% in Mar 2025
About Genus Power Infrastructures Ltd

Company Coordinates


