
Compare Genus Prime with Similar Stocks
Dashboard
Weak Long Term Fundamental Strength with an average Return on Capital Employed (ROCE) of 0.19%
- Low ability to service debt as the company has a high Debt to EBITDA ratio of 11.28 times
Positive results in Mar 26
With ROCE of 0.9, it has a Very Expensive valuation with a 1.1 Enterprise value to Capital Employed
Majority shareholders : Promoters
Market Beating performance in long term as well as near term
Stock DNA
Commodity Chemicals
INR 241 Cr (Micro Cap)
54.00
42
0.00%
0.18
2.12%
1.12
Total Returns (Price + Dividend) 
Genus Prime for the last several years.
Risk Adjusted Returns v/s
Returns Beta

News

Genus Prime Infra Ltd is Rated Hold by MarketsMOJO
Genus Prime Infra Ltd is rated 'Hold' by MarketsMOJO, with this rating last updated on 01 June 2026. While the rating change occurred on that date, the analysis and financial metrics presented here reflect the stock's current position as of 04 June 2026, providing investors with the most up-to-date view of the company’s fundamentals, returns, and market standing.
Read full news article
Genus Prime Infra Q4 FY26: Exceptional Other Income Masks Operational Weakness
Genus Prime Infra Limited reported consolidated net profit of ₹3.96 crores in Q4 FY26, marking an extraordinary surge of 2,540.00% quarter-on-quarter from ₹0.15 crores in Q3 FY26. However, this impressive headline figure conceals a troubling reality: the company's profitability remains overwhelmingly dependent on exceptional other income rather than core business operations. With a market capitalisation of ₹211.00 crores and shares trading at ₹27.05, the micro-cap real estate development company faces fundamental questions about the sustainability of its earnings trajectory.
Read full news article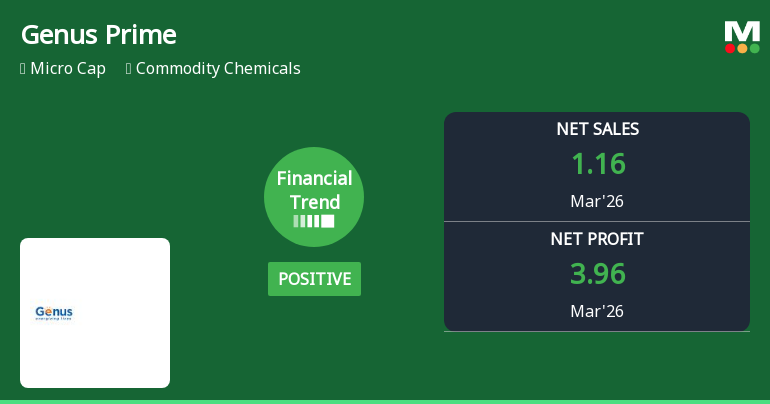
Genus Prime Infra Ltd Reports Strong Quarterly Gains Amid Positive Financial Trend
Genus Prime Infra Ltd, a micro-cap player in the commodity chemicals sector, has demonstrated a notable turnaround in its financial performance for the quarter ended March 2026. The company’s financial trend has shifted from flat to positive, reflecting improved profitability metrics and a stronger earnings profile compared to its recent history.
Read full news article Announcements
Announcement under Regulation 30 (LODR)-Newspaper Publication
01-Jun-2026 | Source : BSECopy of public notice advertised in newspapers
Compliances-Reg.24(A)-Annual Secretarial Compliance
30-May-2026 | Source : BSEAnnual Secretarial Compliance Report for the Financial Year 2025-26
Audited Financial Results For The Quarter And Year Ended March 31 2026
30-May-2026 | Source : BSEAudited Financial Results for the quarter and year ended March 31 2026
Corporate Actions

No Upcoming Board Meetings

No Dividend history available

No Splits history available

No Bonus history available

Genus Prime Infra Ltd has announced 2:33 rights issue, ex-date: 27 Mar 19
Quality key factors
Valuation key factors
Technicals key factors
 Technical Indicator Scale: Bearish, Mildly Bearish, Sideways, Mildly Bullish, Bullish Turned
 Shareholding Snapshot : Mar 2026
Shareholding Compare (%holding)
Promoters
None
Held by 0 Schemes
Held by 0 FIIs
Rajendra Agarwal (29.26%)
Arham Vyapaar Private Limited (3.57%)
18.56%
Quarterly Results Snapshot (Consolidated) - Mar'26 - YoY

YoY Growth in quarter ended Mar 2026 is 5,700.00% vs -33.33% in Mar 2025
YoY Growth in quarter ended Mar 2026 is 19,900.00% vs 0.00% in Mar 2025
Half Yearly Results Snapshot (Consolidated) - Sep'25
Growth in half year ended Sep 2025 is 1,140.00% vs 7.14% in Sep 2024
Growth in half year ended Sep 2025 is 4,800.00% vs 99.50% in Sep 2024
Nine Monthly Results Snapshot (Consolidated) - Dec'25
YoY Growth in nine months ended Dec 2025 is 1,371.43% vs 10.53% in Dec 2024
YoY Growth in nine months ended Dec 2025 is 6,300.00% vs 99.50% in Dec 2024
Annual Results Snapshot (Consolidated) - Mar'26
YoY Growth in year ended Mar 2026 is 1,827.27% vs -4.35% in Mar 2025
YoY Growth in year ended Mar 2026 is 11,575.00% vs 98.00% in Mar 2025
About Genus Prime Infra Ltd

Company Coordinates


