
Compare GFL with Similar Stocks
Dashboard
Weak Long Term Fundamental Strength with a -60.41% CAGR growth in Net Sales over the last 5 years
- Low ability to service debt as the company has a high Debt to EBITDA ratio of 7.11 times
- The company has been able to generate a Return on Equity (avg) of 0.35% signifying low profitability per unit of shareholders funds
With ROE of 1.8, it has a Very Expensive valuation with a 0.2 Price to Book Value
Despite the size of the company, domestic mutual funds hold only 0.2% of the company
Underperformed the market in the last 1 year
Total Returns (Price + Dividend) 
Latest dividend: 3.5 per share ex-dividend date: Sep-11-2019
Risk Adjusted Returns v/s
Returns Beta

News
GFL Ltd is Rated Strong Sell
GFL Ltd is rated Strong Sell by MarketsMOJO, with this rating last updated on 15 Dec 2025. However, the analysis and financial metrics discussed here reflect the company’s current position as of 21 June 2026, providing investors with an up-to-date view of the stock’s fundamentals, valuation, financial trends, and technical outlook.
Read full news article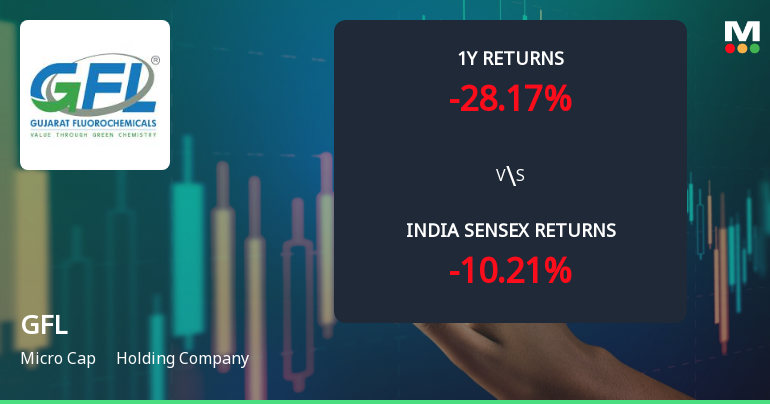
GFL Ltd Technical Momentum Shifts Amid Persistent Downtrend
GFL Ltd, a micro-cap holding company, has experienced a nuanced shift in its technical momentum, reflecting a complex interplay of bullish and bearish signals across multiple timeframes. Despite a recent uptick in price, the stock remains under pressure with a strong sell rating and deteriorating long-term returns compared to the broader Sensex.
Read full news article
GFL Ltd is Rated Strong Sell
GFL Ltd is rated Strong Sell by MarketsMOJO, with this rating last updated on 15 Dec 2025. However, the analysis and financial metrics discussed here reflect the stock’s current position as of 10 June 2026, providing investors with an up-to-date view of the company’s fundamentals, valuation, financial trends, and technical outlook.
Read full news article Announcements
Board Meeting Outcome for Board Meeting Outcome For Outcome Of Board Meeting Pursuant To Regulation 30 Of The SEBI (Listing Obligation And Disclosure Requirements) Regulations 2015
29-May-2026 | Source : BSEPursuant to Regulation 33 of the Listing Regulations the Board of Directors of the Company at its Meeting held today have taken on record the enclosed Audited Standalone and Consolidated Financial Results of the Company for the quarter and year ended 31st March 2026.
Announcement under Regulation 30 (LODR)-Change in Management
29-May-2026 | Source : BSERe-Appointment of Mr. Shashi Kishore Jain(00443861) for second consecutive term of 5 years as Non- Executive Independent Director of the Company.
Financial Results For The Financial Year Ended 31St March 2026.
29-May-2026 | Source : BSEPlease find enclosed Audited Financials of the Company for the period ended March 31 2026 along with Auditors Report.
Corporate Actions

No Upcoming Board Meetings

GFL Ltd has declared 350% dividend, ex-date: 11 Sep 19

GFL Ltd has announced 1:2 stock split, ex-date: 01 Feb 08

No Bonus history available

No Rights history available
Quality key factors
Valuation key factors
Technicals key factors
 Technical Indicator Scale: Bearish, Mildly Bearish, Sideways, Mildly Bullish, Bullish Turned
 Shareholding Snapshot : Mar 2026
Shareholding Compare (%holding)
Promoters
None
Held by 3 Schemes (0.06%)
Held by 3 FIIs (0.16%)
Pavan Kumar Jain (42.16%)
Meenu Bhanshali (5%)
24.14%
Quarterly Results Snapshot (Consolidated) - Mar'26 - YoY

YoY Growth in quarter ended Mar 2026 is 5.95% vs 5.00% in Mar 2025
YoY Growth in quarter ended Mar 2026 is 239.75% vs 10.74% in Mar 2025
Half Yearly Results Snapshot (Consolidated) - Sep'25
Growth in half year ended Sep 2025 is 10.84% vs 0.00% in Sep 2024
Growth in half year ended Sep 2025 is 110.46% vs -638.94% in Sep 2024
Nine Monthly Results Snapshot (Consolidated) - Dec'25
YoY Growth in nine months ended Dec 2025 is 12.50% vs 3.33% in Dec 2024
YoY Growth in nine months ended Dec 2025 is 133.98% vs -543.42% in Dec 2024
Annual Results Snapshot (Consolidated) - Mar'26
YoY Growth in year ended Mar 2026 is 10.84% vs 3.75% in Mar 2025
YoY Growth in year ended Mar 2026 is 159.56% vs -898.55% in Mar 2025
About GFL Ltd

Company Coordinates


