
Compare GHCL with Similar Stocks
Stock DNA
Commodity Chemicals
INR 4,008 Cr (Small Cap)
8.00
43
5.57%
-0.29
13.30%
1.14
Total Returns (Price + Dividend) 
Latest dividend: 11.978196684079037 per share ex-dividend date: Jun-18-2026
Risk Adjusted Returns v/s
Returns Beta

News
GHCL Ltd is Rated Sell by MarketsMOJO
GHCL Ltd is rated Sell by MarketsMOJO, with this rating last updated on 18 Dec 2025. However, the analysis and financial metrics discussed here reflect the stock's current position as of 20 June 2026, providing investors with the most recent insights into the company’s performance and outlook.
Read full news article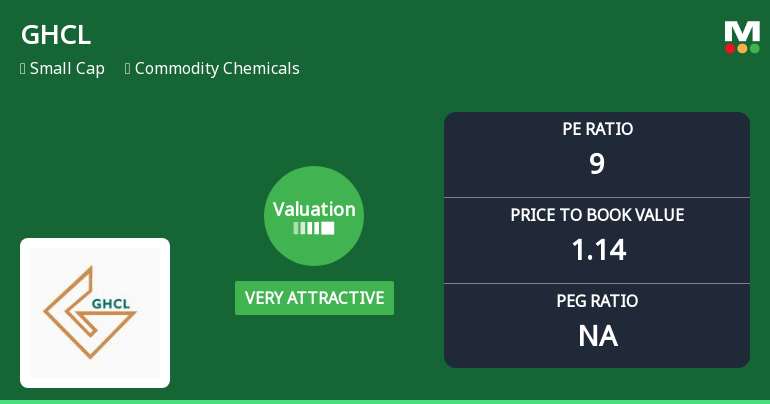
GHCL Ltd Valuation Shifts to Very Attractive Amid Market Challenges
GHCL Ltd, a small-cap player in the commodity chemicals sector, has seen a significant shift in its valuation parameters, moving from an attractive to a very attractive grade. This change comes amid a backdrop of elevated valuations across its peer group, highlighting GHCL’s growing price appeal despite recent share price weakness.
Read full news article
Announcements
Disclosures under Reg. 29(2) of SEBI (SAST) Regulations 2011
18-Jun-2026 | Source : BSEThe Exchange has received the disclosure under Regulation 29(2) of SEBI (Substantial Acquisition of Shares & Takeovers) Regulations 2011 for Neelabh Dalmia
Intimation Under Regulation 30 Read With Regulation 36 Of The SEBI Listing Regulations 2015- Dispatch Of Letter To Shareholders Whose Email-Id Not Registered With Company/RTA
02-Jun-2026 | Source : BSEGHCL intimation under Regulation 30 read with 36 of the SEBI Listing Regulations 2015
Announcement under Regulation 30 (LODR)-Newspaper Publication
02-Jun-2026 | Source : BSEGHCL 2nd Newspaper Advertisement for 43rd AGM
Corporate Actions

No Upcoming Board Meetings

GHCL Ltd has declared 120% dividend, ex-date: 18 Jun 26

No Splits history available

No Bonus history available

No Rights history available
Quality key factors
Valuation key factors
Technicals key factors
 Technical Indicator Scale: Bearish, Mildly Bearish, Sideways, Mildly Bullish, Bullish Turned
 Shareholding Snapshot : Mar 2026
Shareholding Compare (%holding)
Non Institution
1.0963
Held by 11 Schemes (8.97%)
Held by 167 FIIs (24.66%)
Hindustan Commercial Company Limited (3.24%)
Ares Diversified (5.09%)
26.1%
Quarterly Results Snapshot (Consolidated) - Mar'26 - YoY

YoY Growth in quarter ended Mar 2026 is 1.16% vs -5.09% in Mar 2025

YoY Growth in quarter ended Mar 2026 is -23.05% vs 20.35% in Mar 2025
Half Yearly Results Snapshot (Consolidated) - Sep'25
Growth in half year ended Sep 2025 is -6.54% vs -10.92% in Sep 2024
Growth in half year ended Sep 2025 is -17.89% vs -46.33% in Sep 2024
Nine Monthly Results Snapshot (Consolidated) - Dec'25
YoY Growth in nine months ended Dec 2025 is -5.34% vs -8.35% in Dec 2024
YoY Growth in nine months ended Dec 2025 is -24.70% vs -29.17% in Dec 2024
Annual Results Snapshot (Consolidated) - Mar'26
YoY Growth in year ended Mar 2026 is -3.75% vs -7.63% in Mar 2025
YoY Growth in year ended Mar 2026 is -24.30% vs -21.38% in Mar 2025
About GHCL Ltd

Company Coordinates


