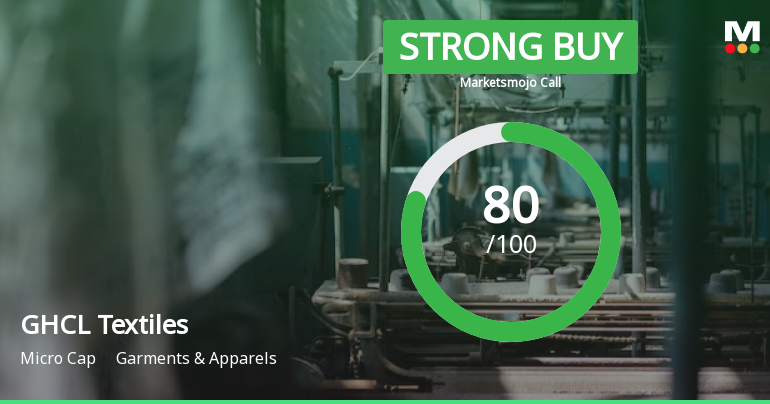
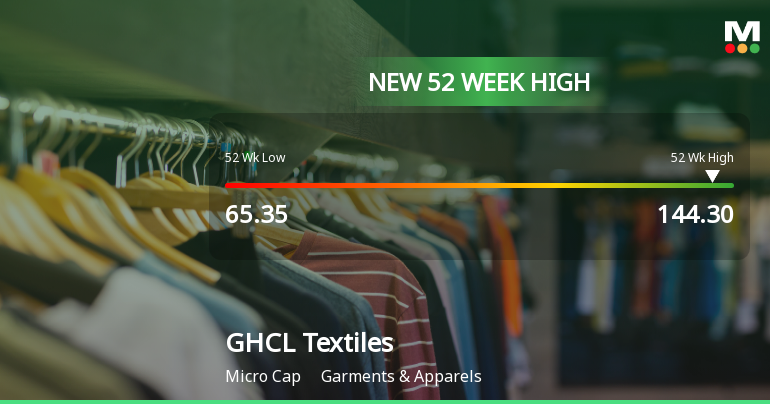
GHCL Textiles

  • Market Cap: Micro Cap
  • Industry: Garments & Apparels
  • ISIN: INE0PA801013
  • NSEID: GHCLTEXTIL
  • BSEID: 543918
INR
119.00
4.92 (4.31%)
BSENSE

Jul 29, 09:48 AM

BSE+NSE Vol: 2.22 lacs

  • Price Points
  • Score
  • Mojo Parameters
  • Total Return
  • News and Corporate Actions
  • Key factors
  • Shareholding
  • Financials
  • CompanyCV
stock-recommendationUpcoming Result: GHCL Textiles will declare its result soon on 30 Jul 2026
stock-summaryPrice Point
High/Low

1Day

52 Week

Valuation
Technical
Day's Volume

CASH

2.22 lacs (307.26%) Volume

Shareholding (Jun 2026)

FII

13.24%

Held by 44 FIIs

DII

1.10%

Held by 3 DIIs

Promoter

19.20%

Why is GHCL Textiles Ltd falling/rising?

29-Jul-2026

As of 28-Jul, GHCL Textiles Ltd's stock price is Rs 114.08, down 1.83% after a three-day gain, indicating a trend reversal. Despite a strong year-to-date increase of 55.80%, today's trading shows selling pressure and increased investor participation, suggesting mixed sentiment.

As of 28-Jul, GHCL Textiles Ltd's stock price is falling, currently at Rs 114.08, which reflects a decrease of Rs 2.13 or 1.83%. This decline comes after a three-day period of consecutive gains, indicating a trend reversal. The stock has underperformed its sector by 0.57% today and reached an intraday low of Rs 113, marking a 2.76% drop. <BR><BR>Despite the recent downturn, the stock has shown strong performance over longer periods, with a year-to-date increase of 55.80% and a one-year rise of 26.81%. However, the current day's trading activity suggests that more volume was traded closer to the low price, indicating selling pressure. Additionally, while the stock's moving averages are higher than the 20-day, 50-day, 100-day, and 200-day averages, it is lower than the 5-day moving average, which may signal short-term weakness. <BR><BR>Investor participation has increased, with delivery volume rising by 47.87% against the 5-day average, suggesting some interest in the stock despite the current price decline. Overall, the combination of recent performance trends, today's underperformance, and the shift in trading dynamics contribute to the stock's falling price.

View full answer

When is the next results date for GHCL Textiles Ltd?

23-Jul-2026

GHCL Textiles Ltd will announce its results on 30 July 2026.

GHCL Textiles Ltd is scheduled to declare its results on 30 July 2026.

View full answer

What does GHCL Textiles do?

11-Jun-2026

GHCL Textiles Ltd produces cotton, blends, and synthetic yarns in the garments industry and is a micro-cap company with a market cap of INR 923 Cr. It reported net sales of 364 Cr and a net profit of 28 Cr for the quarter ending March 2026.

Overview:<BR>GHCL Textiles Ltd is engaged in the production of cotton, blends, and synthetic yarns within the garments and apparels industry, categorized as a micro-cap company.<BR><BR>History:<BR>GHCL Textiles Ltd was incorporated on June 17, 2020. The company became a 100% subsidiary of GHCL Limited and had the Spinning Division of GHCL Limited transferred to it on a going concern basis through a Scheme of Arrangement for Demerger effective from April 1, 2023. The most recent quarterly results reported net sales and net profit for the period ending March 2026.<BR><BR>Financial Snapshot:<BR>Net Sales: 364 Cr (Quarterly Results - Mar 2026) <BR>Net Profit: 28 Cr (Quarterly Results - Mar 2026) <BR>Market Cap: INR 923 Cr (Micro Cap) <BR><BR>Key Metrics:<BR>P/E: 13.00 <BR>Industry P/E: 23 <BR>Dividend Yield: 0.52% <BR>Debt-Equity: 0.08 <BR>Return on Equity: 4.68% <BR>Price to Book: 0.62 <BR><BR>Contact Details:<BR>Details: No Company Details Available <BR>Registrar Address: Not available.

View full answer

How big is GHCL Textiles?

11-Jun-2026

As of 10th June, GHCL Textiles Ltd has a market capitalization of 923.00 Cr and reported net sales of 1318.60 Cr and net profit of 70.37 Cr over the latest four quarters.

As of 10th June, <BR><BR>Market Cap: GHCL Textiles Ltd has a market capitalization of 923.00 Cr and is classified as a Micro Cap.<BR><BR>Recent Quarterly Performance: The sum of Net Sales for the latest 4 quarters is 1318.60 Cr, while the sum of Net Profit for the same period is 70.37 Cr.<BR><BR>Balance Sheet Snapshot: The reporting period is March 2026, with Shareholder's Funds amounting to 1,502.49 Cr and Total Assets totaling 1,870.43 Cr.

View full answer

Who are the peers of the GHCL Textiles?

11-Jun-2026

GHCL Textiles' peers include RSWM Ltd, Nahar Spinning, and Ambika Cotton, among others. In terms of performance, Borana Weaves leads with a 1-year return of 35.02%, while GHCL Textiles has a return of -2.05%.

Peers: The peers of GHCL Textiles are RSWM Ltd, Nahar Spinning, Himatsing. Seide, Ambika Cotton, Mafatlal Inds., Borana Weaves, Sarla Performanc, United Polyfab, and Karnika Industri.<BR><BR>Quality Snapshot: Excellent management risk is observed at Ambika Cotton, while Average management risk is found at Himatsing. Seide, Borana Weaves, Sarla Performanc, United Polyfab, and Karnika Industri, and the rest. Good growth is noted at Ambika Cotton, Mafatlal Inds., GHCL Textiles, Borana Weaves, and Karnika Industri, while Below Average growth is seen at RSWM Ltd, Nahar Spinning, Himatsing. Seide, and the rest. Excellent capital structure is present at Ambika Cotton, GHCL Textiles, Borana Weaves, while Good capital structure is found at Mafatlal Inds. and Sarla Performanc, and the rest.<BR><BR>Return Snapshot: The peer with the highest 1-year return is Borana Weaves at 35.02%, while Himatsing. Seide has the lowest at -50.85%. GHCL Textiles has a 1-year return of -2.05%, which is better than Himatsing. Seide but worse than Borana Weaves. Additionally, Mafatlal Inds., Borana Weaves, and Sarla Performanc have negative six-month returns.

View full answer

Should I buy, sell or hold GHCL Textiles Ltd?

21-May-2026

Are GHCL Textiles Ltd latest results good or bad?

01-May-2026

GHCL Textiles Ltd's latest Q4 FY26 results are strong, with a 94.79% increase in net profit to ₹27.66 crores and a 28.24% rise in revenue to ₹363.69 crores, marking the highest quarterly revenue in the company's history. The improved operating margin and strong financial position indicate positive future prospects despite a recent stock price decline.

GHCL Textiles Ltd's latest results for Q4 FY26 indicate a strong performance overall. The company reported a net profit of ₹27.66 crores, which is a remarkable increase of 94.79% year-on-year. Revenue also saw significant growth, rising by 28.24% year-on-year to reach ₹363.69 crores, marking the highest quarterly revenue since the company's inception.<BR><BR>The operating margin improved to 11.33%, the highest in seven quarters, reflecting enhanced operational efficiency and pricing power. Additionally, the profit after tax (PAT) margin increased to 7.61%, up 260 basis points from the previous year. <BR><BR>Despite a slight decline in stock price recently, GHCL Textiles has shown impressive returns over the past month and year-to-date, outperforming the broader market indices. The company's financial position is strong, with a conservative debt structure and improved cash flow from operations.<BR><BR>Overall, these results suggest that GHCL Textiles is performing well, demonstrating robust growth and operational improvements, which bodes positively for its future prospects.

View full answer

Is GHCL Textiles technically bullish or bearish?

05-Dec-2025

As of December 4, 2025, GHCL Textiles exhibits a mildly bearish trend, supported by bearish indicators from the MACD, Bollinger Bands, and moving averages, despite a mildly bullish signal from the KST on the weekly timeframe.

As of 4 December 2025, the technical trend for GHCL Textiles has changed from bearish to mildly bearish. The current stance is mildly bearish, driven by several key indicators. The weekly MACD remains bearish, and both the weekly and monthly Bollinger Bands indicate a bearish trend. Daily moving averages also confirm a bearish outlook. Although the KST shows a mildly bullish signal on the weekly timeframe, the overall sentiment is tempered by the Dow Theory, which indicates a mildly bearish stance on both weekly and monthly charts. The OBV is mildly bearish on the weekly but mildly bullish on the monthly, suggesting some divergence. Overall, the technical indicators point to a mildly bearish sentiment for GHCL Textiles.

View full answer

How has been the historical performance of GHCL Textiles?

01-Nov-2025

GHCL Textiles has demonstrated significant financial growth over the past three years, with net sales rising to 1,161.16 Cr in March 2025 from 1,053.87 Cr in March 2024, and profit after tax increasing to 55.97 Cr from 25.05 Cr in the same period. Key metrics such as operating profit and earnings per share also improved, indicating enhanced operating efficiency.

Answer:<BR>The historical performance of GHCL Textiles shows significant growth in its financial metrics over the past three years.<BR><BR>Breakdown:<BR>GHCL Textiles reported net sales of 1,161.16 Cr in March 2025, an increase from 1,053.87 Cr in March 2024, and no sales in March 2023. The total operating income followed a similar trend, reaching 1,161.16 Cr in March 2025 compared to 1,053.87 Cr in the previous year. Total expenditure, excluding depreciation, also rose to 1,051.44 Cr in March 2025 from 970.24 Cr in March 2024. Operating profit (PBDIT) increased to 116.68 Cr in March 2025 from 89.26 Cr in March 2024, with a corresponding operating profit margin of 9.45% in March 2025, up from 7.94% in March 2024. Profit before tax reached 63.29 Cr in March 2025, significantly higher than 34.55 Cr in March 2024, leading to a profit after tax of 55.97 Cr in March 2025, compared to 25.05 Cr in March 2024. The earnings per share (EPS) improved to 5.85 in March 2025 from 2.62 in March 2024. On the balance sheet, total assets increased to 1,702.84 Cr in March 2025 from 1,632.86 Cr in March 2024, while total liabilities also rose to 1,702.84 Cr in March 2025 from 1,632.86 Cr in March 2024. Cash flow from operating activities improved to 162.00 Cr in March 2025 from 57.00 Cr in March 2024, although the net cash outflow was recorded at -8.00 Cr in March 2025, down from a net inflow of 10.00 Cr in March 2024. Overall, GHCL Textiles has shown a positive trajectory in its financial performance, with notable increases in sales, profits, and operating efficiency.

View full answer

Who are the top shareholders of the GHCL Textiles?

17-Jul-2025

The top shareholders of GHCL Textiles include Hindustan Commercial Company Limited (3.08%), Ares Diversified (4.9%), individual investors (35.39%), foreign institutional investors (15.67%), and mutual funds (4.71%).

The top shareholders of GHCL Textiles include a mix of institutional and individual investors. The largest promoter is Hindustan Commercial Company Limited, which holds 3.08%. Among public shareholders, Ares Diversified stands out with a holding of 4.9%. Additionally, individual investors collectively hold 35.39% of the shares. The company also has significant participation from foreign institutional investors (FIIs), who hold 15.67%, and mutual funds, which are represented by three schemes holding 4.71%.

View full answer

Is GHCL Textiles overvalued or undervalued?

09-Jun-2025

As of May 6, 2025, GHCL Textiles is considered very attractive with a PE ratio of 15.54, significantly undervalued compared to competitors like K.P.R. Mill Ltd. and Trident Ltd., and has outperformed the Sensex with a 1-year return of 16.46%.

As of 6 May 2025, GHCL Textiles has moved from a fair to a very attractive valuation grade, indicating a significant improvement in its perceived value. The company is currently undervalued, with a PE ratio of 15.54, a Price to Book Value of 0.61, and an EV to EBITDA of 8.46. These ratios suggest that GHCL Textiles is trading at a discount compared to its peers.<BR><BR>In comparison to notable competitors, K.P.R. Mill Ltd. is classified as very expensive with a PE ratio of 47.51, while Trident Ltd. is rated fair with a PE ratio of 42.6. GHCL's PEG ratio of 0.13 further emphasizes its undervaluation relative to the industry. Additionally, GHCL's recent stock performance shows a 1-year return of 16.46%, outperforming the Sensex's 7.55%, which reinforces the attractiveness of its current valuation.

View full answer

Has GHCL Textiles declared dividend?

06-Jun-2025

Yes, GHCL Textiles Ltd has declared a 25% dividend, amounting to ₹0.5 per share, with an ex-date of July 1, 2024. While the company has shown mixed performance in total returns over various periods, the dividend contributes positively to the returns over the past year.

GHCL Textiles Ltd has declared a 25% dividend.<BR><BR>Dividend Details:<BR>- Percentage announced: 25%<BR>- Amount per share: 0.5<BR>- Ex-date: 01 Jul 24<BR><BR>Dividend Yield: 0.55%<BR><BR>Total Returns by Period:<BR>In the last 6 months, the price return was -14.23%, the dividend return was 0%, resulting in a total return of -14.23%.<BR><BR>Over the past year, the price return was 19.25%, the dividend return was 0.60%, leading to a total return of 19.85%.<BR><BR>For the 2-year period, the price return was 0%, the dividend return was 0.74%, resulting in a total return of 0.74%.<BR><BR>In the last 3 years, there was no price return, no dividend return, and the total return was 0.0%.<BR><BR>For the 4-year period, the price return was 0%, the dividend return was 0%, leading to a total return of 0.0%.<BR><BR>Over the past 5 years, there was no price return, no dividend return, and the total return was 0.0%.<BR><BR>Overall, GHCL Textiles has declared a dividend, which contributes positively to the returns over the past year, while the longer-term returns show mixed performance with no dividends in several periods.

View full answer
iScoreScore
Click here to find our call on this stock
Strong Sell
Sell
Hold
Buy
Strong Buy

Dashboard

1

Company has a Debt to Equity ratio (avg) of 0.06 times

 
2

Healthy long term growth as Operating profit has grown by an annual rate 50.37%

 
3

With a growth in Net Profit of 109.86%, the company declared Very Positive results in Mar 26

4

With ROE of 4.7, it has a Very Attractive valuation with a 0.7 Price to Book Value

5

Market Beating performance in long term as well as near term

stock-summaryMojo Parameters

Mojo Parameters

Loading Valuation Snapshot...

Stock DNA

stock-summary
Industry

Garments & Apparels

stock-summary
Market cap

INR 1,137 Cr (Micro Cap)

stock-summary
P/E

16.00

stock-summary
Industry P/E

25

stock-summary
Dividend Yield

0.52%

stock-summary
Debt Equity

0.08

stock-summary
Return on Equity

4.68%

stock-summary
Price to Book

0.73

Revenue and Profits:
Net Sales:
364 Cr
(Quarterly Results - Mar 2026)
Net Profit:
28 Cr
stock-summaryTotal Returns
Total Returns (Price + Dividend) stock-summary
Dividend Yield (0.52%)
TimePeriod
Price Return
Dividend Return
Total Return
3 Months
32.62%
0.67%
33.29%
6 Months
52.31%
0.78%
53.09%
1 Year
29.35%
0.69%
30.04%
2 Years
13.77%
1.03%
14.8%
3 Years
70.95%
2.17%
73.12%
4 Years
0%
0%
0.0%
5 Years
0%
0%
0.0%

Latest dividend: 0.5976826722338205 per share ex-dividend date: Jun-19-2026

Risk Adjusted Returns v/s stock-summary
Returns Beta
Icon
Beta has not been calculated since enough price history is not available
stock-summaryNews & Corporate Actions

Announcements stock-summary

Announcement under Regulation 30 (LODR)-Analyst / Investor Meet - Intimation

23-Jul-2026 | Source : BSE

Earning Conference Call for Q1FY27

Board Meeting Intimation for Board Meeting On July 30 2026 To Consider And Approve The Quarterly Financial Results ESOP Scheme 2026 And Other Business Matters

22-Jul-2026 | Source : BSE

GHCL Textiles Ltdhas informed BSE that the meeting of the Board of Directors of the Company is scheduled on 30/07/2026 inter alia to consider and approve Board Meeting on July 30 2026

Announcement under Regulation 30 (LODR)-Credit Rating

14-Jul-2026 | Source : BSE

Cradit Rating

Corporate Actions stock-summary

stock-summary
BOARD MEETING

30 Jul 2026

stock-summary
DIVIDEND

GHCL Textiles Ltd has declared 30% dividend, ex-date: 19 Jun 26

stock-summary
SPLITS

No Splits history available

stock-summary
BONUS

No Bonus history available

stock-summary
RIGHTS

No Rights history available

stock-summaryKey Factors

Quality key factors stock-summary

Factor
Value
Sales Growth (5y)
11.90%
EBIT Growth (5y)
50.37%
EBIT to Interest (avg)
14.04
Debt to EBITDA (avg)
Negative Net Debt
Net Debt to Equity (avg)
0.08
Sales to Capital Employed (avg)
0.76
Tax Ratio
24.30%
Dividend Payout Ratio
8.15%
Pledged Shares
1.09%
Institutional Holding
14.34%
ROCE (avg)
3.03%
ROE (avg)
4.29%

Valuation key factors

Factor
Value
P/E Ratio
16
Industry P/E
25
Price to Book Value
0.73
EV to EBIT
14.75
EV to EBITDA
8.65
EV to Capital Employed
0.75
EV to Sales
0.92
PEG Ratio
0.60
Dividend Yield
0.52%
ROCE (Latest)
5.06%
ROE (Latest)
4.68%

Technicals key factors

Indicator
Weekly
Monthly
MACD
Bullish
Mildly Bearish
RSI
No Signal
No Signal
Bollinger Bands
Mildly Bullish
Bullish
Moving Averages
Bullish (Daily)
KST
Mildly Bullish
Dow Theory
Mildly Bullish
Mildly Bullish
OBV
Bullish
Bullish
stock-summary Technical Indicator Scale: Bearish, Mildly Bearish, Sideways, Mildly Bullish, Bullish  Turned 
stock-summaryShareholding
Shareholding Snapshot : Jun 2026stock-summary
Shareholding Compare (%holding) stock-summary
Majority shareholders

Non Institution

Pledged Promoter Holdings

1.091

Mutual Funds

Held by 2 Schemes (0.42%)

FIIs

Held by 44 FIIs (13.24%)

Promoter with highest holding

Hindustan Commercial Company Limited (3.08%)

Highest Public shareholder

Ares Diversified (4.9%)

Individual Investors Holdings

41.87%

stock-summaryFinancial
[
  {
    "link": "quarterly",
    "btn_text": "All Quarterly Results",
    "header": "Quarterly Results Snapshot (Standalone) - Mar'26 - QoQ",
    "rhs": [
      {
        "prefix": "Net Sales ",
        "suffix": "QoQ Growth in quarter ended Mar 2026 is 4.17% vs 3.28% in Dec 2025",
        "dir": 1
      },
      {
        "prefix": "Standalone Net Profit ",
        "suffix": "QoQ Growth in quarter ended Mar 2026 is 109.86% vs -17.68% in Dec 2025",
        "dir": 1
      }
    ],
    "table": {
      "header": [
        "Mar'26",
        "Dec'25",
        "Change(%)"
      ],
      "body": [
        {
          "field": "Net Sales",
          "val1": "363.69",
          "val2": "349.12",
          "chgp": "4.17%",
          "chgp_class": "positive"
        },
        {
          "field": "Operating Profit (PBDIT) excl Other Income",
          "val1": "41.19",
          "val2": "31.91",
          "chgp": "29.08%",
          "chgp_class": "positive"
        },
        {
          "field": "Interest",
          "val1": "1.63",
          "val2": "0.91",
          "chgp": "79.12%",
          "chgp_class": "negative"
        },
        {
          "field": "Exceptional Items",
          "val1": "0.00",
          "val2": "0.00",
          "chgp": "",
          "chgp_class": "neutral"
        },
        {
          "field": "Standalone Net Profit",
          "val1": "27.66",
          "val2": "13.18",
          "chgp": "109.86%",
          "chgp_class": "positive"
        },
        {
          "field": "Operating Profit Margin (Excl OI)",
          "val1": "11.33%",
          "val2": "9.14%",
          "chgp": "2.19%",
          "chgp_class": "positive"
        }
      ]
    }
  },
  {
    "link": "half-yearly",
    "btn_text": "All Half Yearly Results",
    "header": "Half Yearly Results Snapshot (Standalone) - Sep'25",
    "rhs": [
      {
        "prefix": "Net Sales ",
        "suffix": " Growth in half year ended Sep 2025 is 2.23% vs 13.23% in Sep 2024",
        "dir": -1
      },
      {
        "prefix": "Standalone Net Profit ",
        "suffix": " Growth in half year ended Sep 2025 is -8.86% vs 214.26% in Sep 2024",
        "dir": -1
      }
    ],
    "table": {
      "header": [
        "Sep'25",
        "Sep'24",
        "Change(%)"
      ],
      "body": [
        {
          "field": "Net Sales",
          "val1": "605.79",
          "val2": "592.55",
          "chgp": "2.23%",
          "chgp_class": "positive"
        },
        {
          "field": "Operating Profit (PBDIT) excl Other Income",
          "val1": "66.81",
          "val2": "55.51",
          "chgp": "20.36%",
          "chgp_class": "positive"
        },
        {
          "field": "Interest",
          "val1": "2.71",
          "val2": "1.48",
          "chgp": "83.11%",
          "chgp_class": "negative"
        },
        {
          "field": "Exceptional Items",
          "val1": "0.00",
          "val2": "0.00",
          "chgp": "",
          "chgp_class": "neutral"
        },
        {
          "field": "Standalone Net Profit",
          "val1": "29.53",
          "val2": "32.40",
          "chgp": "-8.86%",
          "chgp_class": "negative"
        },
        {
          "field": "Operating Profit Margin (Excl OI)",
          "val1": "11.03%",
          "val2": "9.37%",
          "chgp": "1.66%",
          "chgp_class": "positive"
        }
      ]
    }
  },
  {
    "link": "nine-monthly",
    "btn_text": "All Nine Monthly Results",
    "header": "Nine Monthly Results Snapshot (Standalone) - Dec'25",
    "rhs": [
      {
        "prefix": "Net Sales ",
        "suffix": "YoY Growth in nine months ended Dec 2025 is 8.82% vs 14.31% in Dec 2024",
        "dir": -1
      },
      {
        "prefix": "Standalone Net Profit ",
        "suffix": "YoY Growth in nine months ended Dec 2025 is 2.25% vs 182.23% in Dec 2024",
        "dir": -1
      }
    ],
    "table": {
      "header": [
        "Dec'25",
        "Dec'24",
        "Change(%)"
      ],
      "body": [
        {
          "field": "Net Sales",
          "val1": "954.91",
          "val2": "877.55",
          "chgp": "8.82%",
          "chgp_class": "positive"
        },
        {
          "field": "Operating Profit (PBDIT) excl Other Income",
          "val1": "98.72",
          "val2": "78.95",
          "chgp": "25.04%",
          "chgp_class": "positive"
        },
        {
          "field": "Interest",
          "val1": "3.62",
          "val2": "2.07",
          "chgp": "74.88%",
          "chgp_class": "negative"
        },
        {
          "field": "Exceptional Items",
          "val1": "0.00",
          "val2": "0.00",
          "chgp": "",
          "chgp_class": "neutral"
        },
        {
          "field": "Standalone Net Profit",
          "val1": "42.71",
          "val2": "41.77",
          "chgp": "2.25%",
          "chgp_class": "positive"
        },
        {
          "field": "Operating Profit Margin (Excl OI)",
          "val1": "10.34%",
          "val2": "9.00%",
          "chgp": "1.34%",
          "chgp_class": "positive"
        }
      ]
    }
  },
  {
    "link": "annual",
    "btn_text": "All Annual Results",
    "header": "Annual Results Snapshot (Standalone) - Mar'26",
    "rhs": [
      {
        "prefix": "Net Sales ",
        "suffix": "YoY Growth in year ended Mar 2026 is 13.56% vs 10.18% in Mar 2025",
        "dir": 1
      },
      {
        "prefix": "Standalone Net Profit ",
        "suffix": "YoY Growth in year ended Mar 2026 is 25.73% vs 123.43% in Mar 2025",
        "dir": -1
      }
    ],
    "table": {
      "header": [
        "Mar'26",
        "Mar'25",
        "Change(%)"
      ],
      "body": [
        {
          "field": "Net Sales",
          "val1": "1,318.60",
          "val2": "1,161.16",
          "chgp": "13.56%",
          "chgp_class": "positive"
        },
        {
          "field": "Operating Profit (PBDIT) excl Other Income",
          "val1": "139.91",
          "val2": "109.72",
          "chgp": "27.52%",
          "chgp_class": "positive"
        },
        {
          "field": "Interest",
          "val1": "5.25",
          "val2": "2.74",
          "chgp": "91.61%",
          "chgp_class": "negative"
        },
        {
          "field": "Exceptional Items",
          "val1": "0.00",
          "val2": "0.00",
          "chgp": "",
          "chgp_class": "neutral"
        },
        {
          "field": "Standalone Net Profit",
          "val1": "70.37",
          "val2": "55.97",
          "chgp": "25.73%",
          "chgp_class": "positive"
        },
        {
          "field": "Operating Profit Margin (Excl OI)",
          "val1": "10.61%",
          "val2": "9.45%",
          "chgp": "1.16%",
          "chgp_class": "positive"
        }
      ]
    }
  }
]

Quarterly Results Snapshot (Standalone) - Mar'26 - QoQstock-summary

Mar'26
Dec'25
Change(%)
Net Sales
363.69
349.12
4.17%
Operating Profit (PBDIT) excl Other Income
41.19
31.91
29.08%
Interest
1.63
0.91
79.12%
Exceptional Items
0.00
0.00
Standalone Net Profit
27.66
13.18
109.86%
Operating Profit Margin (Excl OI)
11.33%
9.14%
2.19%
Values in Rs Cr.
Direction Arrows
Net Sales

QoQ Growth in quarter ended Mar 2026 is 4.17% vs 3.28% in Dec 2025

Direction Arrows
Standalone Net Profit

QoQ Growth in quarter ended Mar 2026 is 109.86% vs -17.68% in Dec 2025

Half Yearly Results Snapshot (Standalone) - Sep'25stock-summary

Sep'25
Sep'24
Change(%)
Net Sales
605.79
592.55
2.23%
Operating Profit (PBDIT) excl Other Income
66.81
55.51
20.36%
Interest
2.71
1.48
83.11%
Exceptional Items
0.00
0.00
Standalone Net Profit
29.53
32.40
-8.86%
Operating Profit Margin (Excl OI)
11.03%
9.37%
1.66%
Values in Rs Cr.
Direction Arrows
Net Sales

Growth in half year ended Sep 2025 is 2.23% vs 13.23% in Sep 2024

Direction Arrows
Standalone Net Profit

Growth in half year ended Sep 2025 is -8.86% vs 214.26% in Sep 2024

Nine Monthly Results Snapshot (Standalone) - Dec'25stock-summary

Dec'25
Dec'24
Change(%)
Net Sales
954.91
877.55
8.82%
Operating Profit (PBDIT) excl Other Income
98.72
78.95
25.04%
Interest
3.62
2.07
74.88%
Exceptional Items
0.00
0.00
Standalone Net Profit
42.71
41.77
2.25%
Operating Profit Margin (Excl OI)
10.34%
9.00%
1.34%
Values in Rs Cr.
Direction Arrows
Net Sales

YoY Growth in nine months ended Dec 2025 is 8.82% vs 14.31% in Dec 2024

Direction Arrows
Standalone Net Profit

YoY Growth in nine months ended Dec 2025 is 2.25% vs 182.23% in Dec 2024

Annual Results Snapshot (Standalone) - Mar'26stock-summary

Mar'26
Mar'25
Change(%)
Net Sales
1,318.60
1,161.16
13.56%
Operating Profit (PBDIT) excl Other Income
139.91
109.72
27.52%
Interest
5.25
2.74
91.61%
Exceptional Items
0.00
0.00
Standalone Net Profit
70.37
55.97
25.73%
Operating Profit Margin (Excl OI)
10.61%
9.45%
1.16%
Values in Rs Cr.
Direction Arrows
Net Sales

YoY Growth in year ended Mar 2026 is 13.56% vs 10.18% in Mar 2025

Direction Arrows
Standalone Net Profit

YoY Growth in year ended Mar 2026 is 25.73% vs 123.43% in Mar 2025

stock-summaryCompany CV
About GHCL Textiles Ltd stock-summary
stock-summary
GHCL Textiles Ltd
Micro Cap
Garments & Apparels
GHCL Textiles Limited was incorporated on June 17, 2020. The Company is a 100% subsidiary of GHCL Limited (Holding Company). The Company is engaged in Cotton, Blends and Synthetic Yarns. In 2022-23, the Spinning Division of GHCL Limited was transferred to the Company on a going concern basis through the Scheme of Arrangement for Demerger effective from April 1, 2023.
Company Coordinates stock-summary
Icon
No Company Details Available