
Compare GHV Infra with Similar Stocks
Stock DNA
Computers - Software & Consulting
INR 1,565 Cr (Small Cap)
34.00
33
0.00%
1.48
34.21%
12.79
Total Returns (Price + Dividend) 
GHV Infra for the last several years.
Risk Adjusted Returns v/s
Returns Beta

News

GHV Infra Projects Ltd is Rated Sell by MarketsMOJO
GHV Infra Projects Ltd is rated 'Sell' by MarketsMOJO, with this rating last updated on 08 May 2026. However, the analysis and financial metrics discussed here reflect the stock's current position as of 02 June 2026, providing investors with an up-to-date view of the company’s fundamentals, returns, and market standing.
Read full news article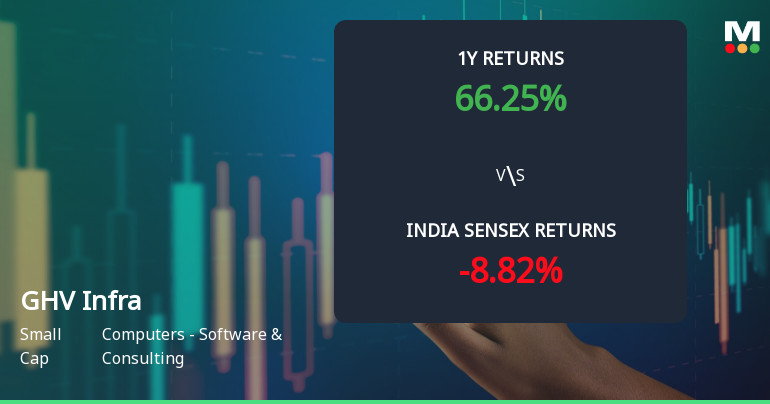
GHV Infra Projects Ltd Technical Momentum Shifts Amid Mixed Market Signals
GHV Infra Projects Ltd, a small-cap player in the Computers - Software & Consulting sector, has experienced a notable shift in its technical momentum, reflecting a complex interplay of bearish and mildly bullish signals. Despite a recent upgrade from Hold to Sell by MarketsMOJO on 8 May 2026, the stock’s price action and technical indicators reveal a nuanced picture that investors should carefully analyse.
Read full news article
GHV Infra Projects Ltd Reports Very Positive Quarterly Financial Performance Amid Mixed Market Returns
GHV Infra Projects Ltd has delivered a notably strong quarterly performance for the period ending March 2026, marking a significant improvement in its financial trend from positive to very positive. Despite a recent downgrade in its Mojo Grade to Sell, the company posted record-high revenues and profitability metrics, signalling robust operational execution amid a challenging market environment.
Read full news article Announcements
Intimation Of Submission Of Application For Reclassification Of Person Forming Part Of The Promoter / Promoter Group From Promoter Group Category To Public Category Shareholder Of The Company Pursuant To Regulation 31A Of Securities And Exchange Board Of
26-May-2026 | Source : BSEAs per enclosed intimation
Announcement under Regulation 30 (LODR)-Newspaper Publication
25-May-2026 | Source : BSEThe Company has informed the exchange about the newspaper publication of Audited Financial Results for the Quarter and Year ended March 31 2026
Financial Results For The Quarter And Year Ended March 31 2026
22-May-2026 | Source : BSEThe Company has informed the exchange about the Financial Results for the Quarter and Year ended March 31 2026
Corporate Actions

No Upcoming Board Meetings

No Dividend history available

GHV Infra Projects Ltd has announced 5:10 stock split, ex-date: 16 Sep 25

GHV Infra Projects Ltd has announced 3:2 bonus issue, ex-date: 16 Sep 25

No Rights history available
Quality key factors
Valuation key factors
Technicals key factors
 Technical Indicator Scale: Bearish, Mildly Bearish, Sideways, Mildly Bullish, Bullish Turned
 Shareholding Snapshot : Mar 2026
Shareholding Compare (%holding)
Promoters
19.5157
Held by 0 Schemes
Held by 0 FIIs
Jhv Commercials Llp (58.78%)
Fortune Financial And Equities Services Private Limited (10%)
23.38%
Quarterly Results Snapshot (Standalone) - Mar'26 - YoY

YoY Growth in quarter ended Mar 2026 is 29.49% vs 0.00% in Mar 2025

YoY Growth in quarter ended Mar 2026 is 41.92% vs 17,575.00% in Mar 2025
Half Yearly Results Snapshot (Standalone) - Sep'25
Growth in half year ended Sep 2025 is 25,064.76% vs 0.00% in Sep 2024
Growth in half year ended Sep 2025 is 7,490.48% vs 163.64% in Sep 2024
Nine Monthly Results Snapshot (Standalone) - Dec'25
YoY Growth in nine months ended Dec 2025 is 1,908.92% vs 0.00% in Dec 2024
YoY Growth in nine months ended Dec 2025 is 607.26% vs 980.56% in Dec 2024
Annual Results Snapshot (Standalone) - Mar'26
YoY Growth in year ended Mar 2026 is 227.53% vs 0.00% in Mar 2025
YoY Growth in year ended Mar 2026 is 146.41% vs 4,088.37% in Mar 2025
About GHV Infra Projects Ltd


