
Compare Gini Silk Mills with Similar Stocks
Dashboard
Weak Long Term Fundamental Strength with an average Return on Capital Employed (ROCE) of 0.82%
- Poor long term growth as Operating profit has grown by an annual rate 13.83% of over the last 5 years
- Company's ability to service its debt is weak with a poor EBIT to Interest (avg) ratio of 0.07
Flat results in Mar 26
Risky - Negative Operating Profits
Below par performance in long term as well as near term
Stock DNA
Trading & Distributors
INR 32 Cr (Micro Cap)
20.00
25
0.00%
-0.01
3.07%
0.61
Total Returns (Price + Dividend) 
Latest dividend: 0.5 per share ex-dividend date: Mar-16-2020
Risk Adjusted Returns v/s
Returns Beta

News
Gini Silk Mills Ltd is Rated Strong Sell
Gini Silk Mills Ltd is rated Strong Sell by MarketsMOJO, with this rating last updated on 03 Feb 2025. However, the analysis and financial metrics discussed here reflect the stock’s current position as of 19 June 2026, providing investors with an up-to-date view of the company’s fundamentals, valuation, financial trend, and technical outlook.
Read full news article
Gini Silk Mills Ltd is Rated Strong Sell
Gini Silk Mills Ltd is rated Strong Sell by MarketsMOJO. This rating was last updated on 03 Feb 2025. However, the analysis and financial metrics discussed here reflect the company’s current position as of 28 May 2026, providing investors with the latest insights into the stock’s performance and outlook.
Read full news article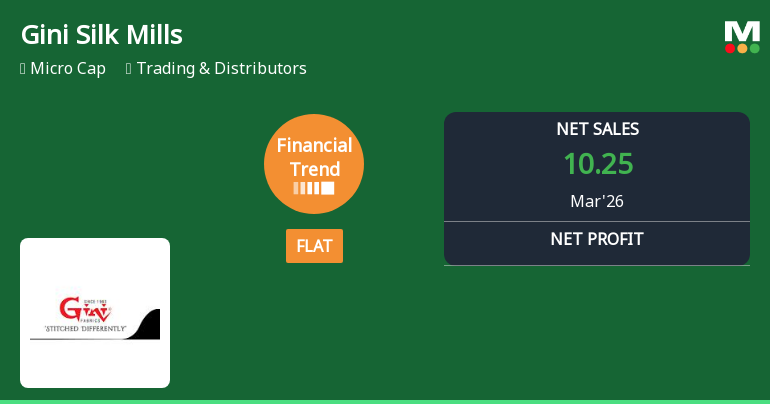
Gini Silk Mills Ltd Reports Flat Quarterly Performance Amid Mixed Financial Trends
Gini Silk Mills Ltd, a micro-cap player in the Trading & Distributors sector, has reported a flat financial performance for the quarter ended March 2026, signalling a stabilisation after a period of decline. Despite a modest improvement in profitability, the company continues to face challenges with its return on capital employed, reflecting ongoing margin pressures in a competitive industry environment.
Read full news article Announcements
Clarification Regarding Delay In Submission Of Outcome Of Board Meeting Under Regulation 30 Of SEBI (LODR) Regulations 2015
25-May-2026 | Source : BSEPlease find attached Clarification regarding delay in submission of Outcome of Board Meeting under Regulation 30 of the SEBI(Listing Obligations and Disclosures Requirements)Regulations 2015. Kindly take the same on record.
Announcement under Regulation 30 (LODR)-Newspaper Publication
23-May-2026 | Source : BSEPursuant to Provisions of Regulation 47 and 30 of the SEBI(Listing Obligations and Disclosures Requirements) REgulations 2015 Please find enclosed copy of newspaper publication of Audited Financial Results for the Fourth Quarter and Financial Year ended March 31 2026.
Board Meeting Outcome for Board Meeting Outcome For The Meeting Held On Friday May 22 2026.
22-May-2026 | Source : BSEThis is to inform the Exchange that pursuant to Regulation 30(2) of the Securities and Exchange Board of India (Listing Obligations and Disclosure Requirements) Regulations 2015 the Meeting of Board of Directors of the Company was held on Friday May 22 2026 at 3:00 P.M. at the registered office of the Company at 413 Jogani Industrial Estate Opp. Kasturba -Hospital J. R. Boricha Marg Lower Parel (East) Mumbai- 400011 wherein the following decisions were taken: 1. Approval of Audited Financial Results along with the Auditors Report of the Statutory Auditors thereon for the Fourth Quarter and Financial Year ended on March 31 2026 as per Regulation 33 of the Securities and Exchange Board of India (Listing Obligations and Disclosure Requirements) Regulations 2015.
Corporate Actions

No Upcoming Board Meetings

Gini Silk Mills Ltd has declared 5% dividend, ex-date: 16 Mar 20

No Splits history available

No Bonus history available

No Rights history available
Quality key factors
Valuation key factors
Technicals key factors
 Technical Indicator Scale: Bearish, Mildly Bearish, Sideways, Mildly Bullish, Bullish Turned
 Shareholding Snapshot : Mar 2026
Shareholding Compare (%holding)
Promoters
None
Held by 0 Schemes
Held by 0 FIIs
Deepak Harlalka (33.98%)
Religare Finvest Ltd (4.11%)
13.25%
Quarterly Results Snapshot (Standalone) - Mar'26 - QoQ

QoQ Growth in quarter ended Mar 2026 is 15.04% vs -17.12% in Dec 2025
QoQ Growth in quarter ended Mar 2026 is 4.55% vs -78.00% in Dec 2025
Half Yearly Results Snapshot (Standalone) - Sep'25
Growth in half year ended Sep 2025 is 1.17% vs -9.02% in Sep 2024
Growth in half year ended Sep 2025 is 1.79% vs -35.26% in Sep 2024
Nine Monthly Results Snapshot (Standalone) - Dec'25
YoY Growth in nine months ended Dec 2025 is -0.69% vs -9.69% in Dec 2024
YoY Growth in nine months ended Dec 2025 is -7.48% vs -36.91% in Dec 2024
Annual Results Snapshot (Standalone) - Mar'26
YoY Growth in year ended Mar 2026 is -2.47% vs -8.46% in Mar 2025
YoY Growth in year ended Mar 2026 is -11.67% vs -40.79% in Mar 2025
About Gini Silk Mills Ltd

Company Coordinates


