
Stock DNA
Pharmaceuticals & Biotechnology
USD 662 Million (Micro Cap)
NA (Loss Making)
NA
0.00%
-0.79
-49.94%
1.08
Total Returns (Price + Dividend) 
Ginkgo Bioworks Holdings, Inc. for the last several years.
Risk Adjusted Returns v/s
News
Ginkgo Bioworks Holdings, Inc. Experiences Revision in Stock Evaluation Amid Strong Market Performance
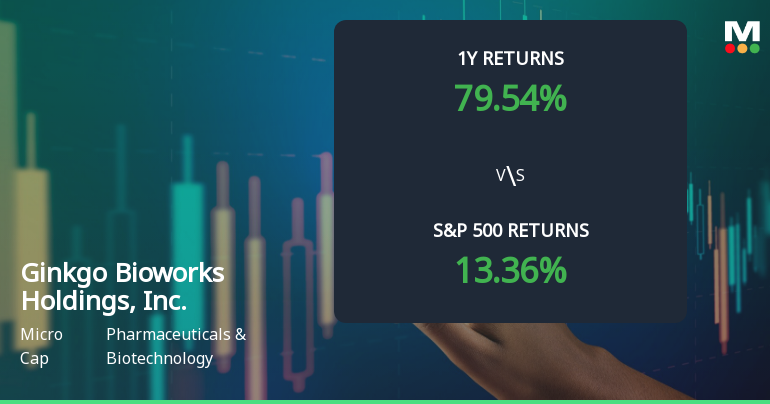
Ginkgo Bioworks Holdings, Inc. has recently seen a stock price adjustment, currently at $13.16. Over the past year, the company has achieved a remarkable 79.54% return, significantly surpassing the S&P 500. Various technical indicators suggest a mixed outlook, reflecting the company's resilience in the Pharmaceuticals & Biotechnology sector.
Read MoreIs Ginkgo Bioworks Holdings, Inc. technically bullish or bearish?
As of 10 October 2025, the technical trend for Ginkgo Bioworks Holdings, Inc. has changed from bullish to mildly bullish. The weekly MACD is bullish, while the monthly MACD is mildly bullish. The daily moving averages indicate a bullish stance, but the KST shows a mildly bearish trend on both weekly and monthly time frames. The Dow Theory supports a mildly bullish outlook for both weekly and monthly periods. In terms of returns, Ginkgo Bioworks has outperformed the S&P 500 significantly over the past year, with a return of 79.54% compared to the S&P 500's 13.36%. However, it experienced a sharp decline of 11.5% over the past week, while the S&P 500 fell only 2.43%. Overall, the current technical stance is mildly bullish, driven by the mixed signals from MACD, moving averages, and Dow Theory....
Read MoreIs Ginkgo Bioworks Holdings, Inc. technically bullish or bearish?
As of 10 October 2025, the technical trend for Ginkgo Bioworks Holdings, Inc. has changed from bullish to mildly bullish. The weekly MACD is bullish, while the monthly MACD is mildly bullish, indicating a positive but weakening momentum. The daily moving averages are bullish, supporting the mildly bullish stance. However, the KST shows a mildly bearish signal on both weekly and monthly time frames, which adds some caution. The Dow Theory confirms a mildly bullish trend on both weekly and monthly levels. In terms of performance, Ginkgo Bioworks has significantly outperformed the S&P 500 over the past year with an 88.3% return compared to the S&P's 13.36%. Over three years, the stock has returned 367.82% versus the S&P's 81.39%. Overall, the current technical stance is mildly bullish, driven by the mixed signals from MACD, moving averages, and Dow Theory....
Read More Announcements

Corporate Actions
Quality key factors
Valuation key factors
Technicals key factors
 Technical Indicator Scale: Bearish, Mildly Bearish, Sideways, Mildly Bullish, Bullish Turned
 Shareholding Snapshot : Mar 2025
Shareholding Compare (%holding)
Foreign Institutions
Held in 45 Schemes (16.98%)
Held by 124 Foreign Institutions (24.2%)
Quarterly Results Snapshot (Consolidated) - Jun'25 - QoQ

QoQ Growth in quarter ended Jun 2025 is 2.69% vs 10.27% in Mar 2025

QoQ Growth in quarter ended Jun 2025 is 33.74% vs 15.35% in Mar 2025
Annual Results Snapshot (Consolidated) - Dec'24
YoY Growth in year ended Dec 2024 is -9.74% vs -47.35% in Dec 2023
YoY Growth in year ended Dec 2024 is 38.74% vs 57.61% in Dec 2023
About Ginkgo Bioworks Holdings, Inc.

Company Coordinates


