
Compare GKB Ophthalmics with Similar Stocks
Stock DNA
Healthcare Services
INR 31 Cr (Micro Cap)
11.00
46
0.00%
0.13
5.68%
0.59
Total Returns (Price + Dividend) 
Latest dividend: 1.2000 per share ex-dividend date: Sep-21-2010
Risk Adjusted Returns v/s
Returns Beta

News

GKB Ophthalmics Ltd Downgraded to Sell Amid Mixed Financial Signals and Weak Fundamentals
GKB Ophthalmics Ltd has been downgraded from a Hold to a Sell rating by MarketsMOJO as of 8 June 2026, reflecting a complex interplay of financial performance, valuation metrics, and technical indicators. Despite recent positive earnings growth and attractive valuation multiples, the company’s weak long-term fundamentals and persistent underperformance against benchmarks have prompted a cautious stance.
Read full news article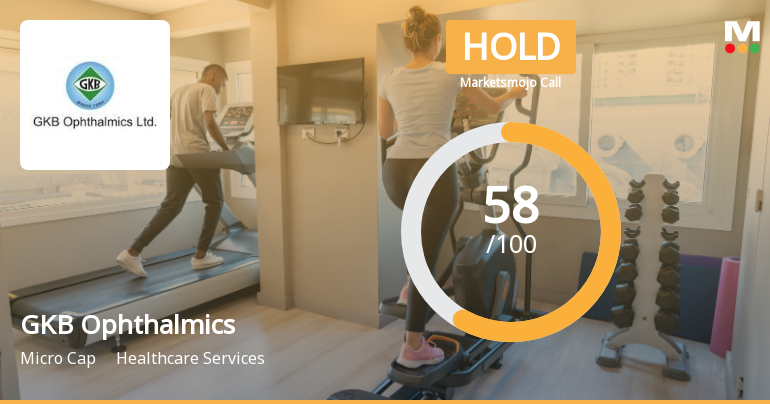
GKB Ophthalmics Ltd Upgraded to Hold on Improved Valuation and Financial Trends
GKB Ophthalmics Ltd has seen its investment rating upgraded from Sell to Hold as of 29 May 2026, reflecting a marked improvement in valuation metrics and financial performance despite ongoing challenges in long-term fundamentals and market returns. The company’s mojo score has risen to 58.0, signalling a more balanced outlook for investors amid a micro-cap classification and a recent share price decline of 1.95%.
Read full news article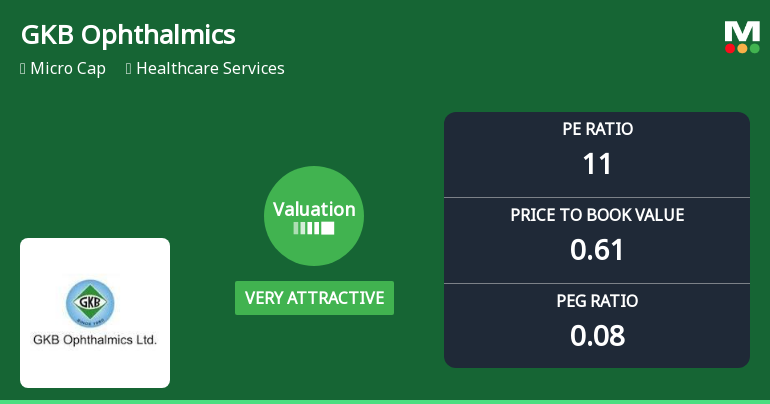
GKB Ophthalmics Ltd Valuation Shifts Signal Renewed Price Attractiveness
GKB Ophthalmics Ltd has witnessed a significant improvement in its valuation parameters, transitioning from a risky to a very attractive investment proposition. With a current price of ₹63.73 and a micro-cap market classification, the healthcare services company’s price-to-earnings (P/E) and price-to-book value (P/BV) ratios now present compelling value compared to historical levels and peer averages, prompting an upgrade in its Mojo Grade from Sell to Hold as of 29 May 2026.
Read full news article Announcements
Announcement under Regulation 30 (LODR)-Newspaper Publication
01-Jun-2026 | Source : BSEPlease find enclosed copies of newspaper cuttings of the extract of statement of audited Standalone and Consolidated Financial Results for the year ended March 31 2026 published in Free Press Journal (Mumbai Edition) and on Pudhari (Marathi) dated May 29 2026. Please acknowledge receipt.
Compliances-Reg.24(A)-Annual Secretarial Compliance
23-May-2026 | Source : BSEPursuant to Regulation 24A of SEBI (Listing Obligations and Disclosure Requirements) Regulations 2015 enclosed please find the Annual Secretarial Compliance Report for the year ended March 31 2026 issued by Ms. Girija Nagvekar Practicing Company Secretary and Secretarial Auditor of the Company. Kindly take the above information on record.
Board Meeting Intimation for Approval Of Audited Financial Results For The Quarter And Year Ende March 31 2026.
04-May-2026 | Source : BSEGKB Ophthalmics Ltdhas informed BSE that the meeting of the Board of Directors of the Company is scheduled on 27/05/2026 inter alia to consider and approve the Audited Standalone and Consolidated Financial Results of the company for the qurter and year ended March 31 2026. The Notice can be accessed at the Companys website at www.gkb.net Further notice is hereby given with reference to the above meeting of the Board of Directors that the Trading Window for dealing with equity shares of the Company by designated persons under the SEBI (Prohibition of Insider Trading) Regulation 2015 had been closed from April 01 2026 will now re-open after the completion of 48 hours from the date of submission of financial results to the Stock Exchange. This communication has been sent to all the Directors sand all the designated emplyoyees of the Company.
Corporate Actions

No Upcoming Board Meetings

GKB Ophthalmics Ltd has declared 12% dividend, ex-date: 21 Sep 10

No Splits history available

No Bonus history available

No Rights history available
Quality key factors
Valuation key factors
Technicals key factors
 Technical Indicator Scale: Bearish, Mildly Bearish, Sideways, Mildly Bullish, Bullish Turned
 Shareholding Snapshot : Mar 2026
Shareholding Compare (%holding)
Promoters
None
Held by 0 Schemes
Held by 1 FIIs (1.79%)
Krishna Gopal Gupta (17.91%)
Krishna Murari Gupta (5.54%)
38.52%
Quarterly Results Snapshot (Consolidated) - Mar'26 - QoQ

QoQ Growth in quarter ended Mar 2026 is -47.54% vs 88.23% in Dec 2025

QoQ Growth in quarter ended Mar 2026 is -56.82% vs -72.50% in Dec 2025
Half Yearly Results Snapshot (Consolidated) - Sep'25
Growth in half year ended Sep 2025 is 19.79% vs 22.27% in Sep 2024
Growth in half year ended Sep 2025 is 139.46% vs -129.69% in Sep 2024
Nine Monthly Results Snapshot (Consolidated) - Dec'25
YoY Growth in nine months ended Dec 2025 is 52.99% vs 16.88% in Dec 2024
YoY Growth in nine months ended Dec 2025 is 129.14% vs -85.19% in Dec 2024
Annual Results Snapshot (Consolidated) - Mar'26
YoY Growth in year ended Mar 2026 is 36.76% vs 23.50% in Mar 2025
YoY Growth in year ended Mar 2026 is 117.33% vs -150.53% in Mar 2025
About GKB Ophthalmics Ltd

Company Coordinates


