
Compare GKW with Similar Stocks
Dashboard
With a Operating Losses, the company has a Weak Long Term Fundamental Strength
- The company has been able to generate a Return on Equity (avg) of 1.08% signifying low profitability per unit of shareholders funds
- PBT LESS OI(Q) At Rs -9.26 cr has Fallen at -5874.2% (vs previous 4Q average)
- NET SALES(Latest six months) At Rs 6.66 cr has Grown at -22.38%
- PAT(Latest six months) At Rs -0.53 cr has Grown at -22.38%
With ROE of -0.1, it has a Very Expensive valuation with a 0.4 Price to Book Value
Below par performance in long term as well as near term
Stock DNA
Auto Components & Equipments
INR 1,080 Cr (Micro Cap)
NA (Loss Making)
29
0.00%
-0.11
-0.09%
0.42
Total Returns (Price + Dividend) 
GKW for the last several years.
Risk Adjusted Returns v/s
Returns Beta

News
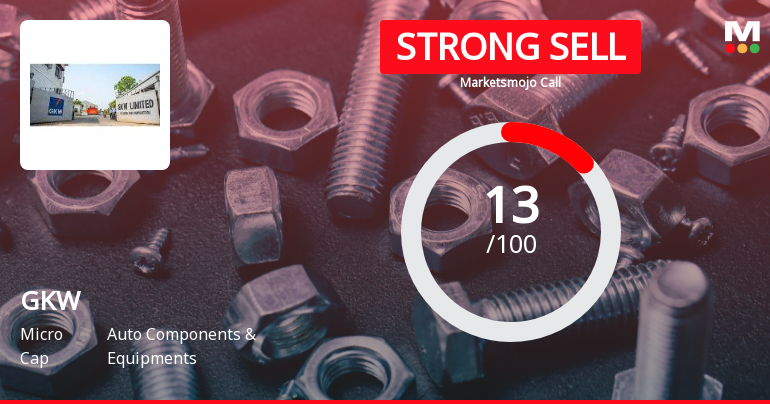
GKW Ltd is Rated Strong Sell
GKW Ltd is rated Strong Sell by MarketsMOJO, with this rating last updated on 27 May 2026. However, the analysis and financial metrics discussed here reflect the stock’s current position as of 08 June 2026, providing investors with an up-to-date view of the company’s fundamentals, valuation, financial trends, and technical outlook.
Read full news article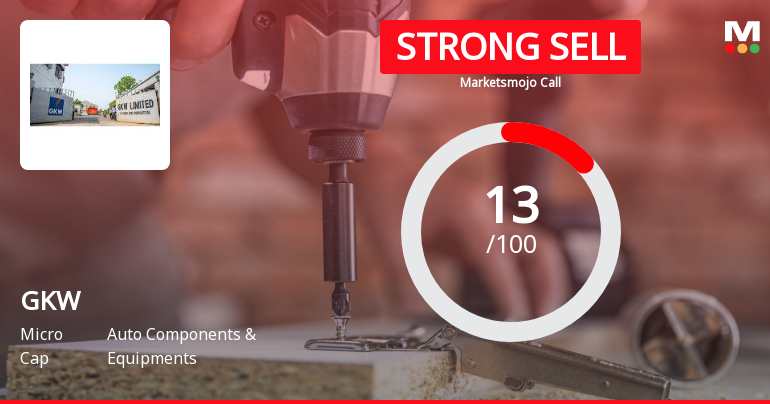
GKW Ltd is Rated Strong Sell
GKW Ltd is rated Strong Sell by MarketsMOJO, with this rating last updated on 27 May 2026. However, the analysis and financial metrics discussed here reflect the stock's current position as of 08 June 2026, providing investors with the latest insights into the company’s performance and outlook.
Read full news article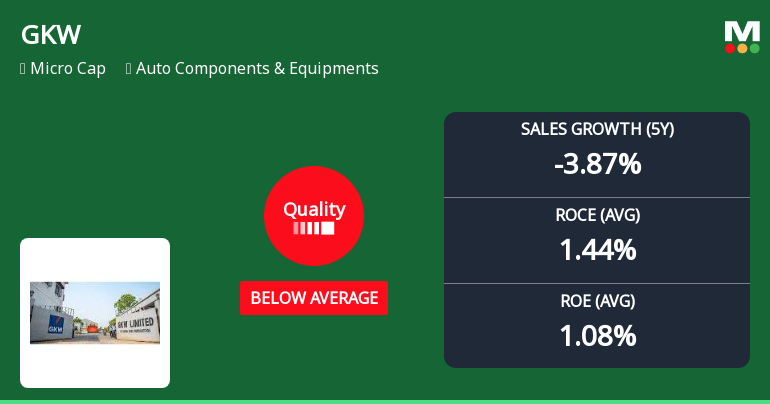
GKW Ltd Downgraded to Strong Sell as Quality Metrics Deteriorate
GKW Ltd, a micro-cap player in the Auto Components & Equipments sector, has seen its quality grade downgraded from average to below average as of 6 January 2025, reflecting deteriorating business fundamentals. Despite a strong long-term stock return, recent financial metrics reveal significant challenges in profitability, capital efficiency, and growth consistency, prompting a MarketsMOJO rating downgrade to Strong Sell with a Mojo Score of 13.0.
Read full news article Announcements
GKW Limited - Updates
18-Nov-2019 | Source : NSEGKW Limited : GKW Limited has informed the Exchange regarding 'Notice of Striking Off and Dissolution of GKW (Overseas Trading) Limited, a wholly owned Subsidiary Company of GKW Limited'.
GKW Limited - Updates
13-Nov-2019 | Source : NSEGKW Limited : GKW Limited has informed the Exchange regarding 'This is to inform you that Mr. Jay Narayan Ghosh, Vice President & Secretary who was the Compliance Officer of the Company will retire from the services of the Company at the close of business hours of 31st December, 2019.
GKW Limited - Trading Window
25-Oct-2019 | Source : NSEGKW Limited : GKW Limited has informed the Exchange regarding the Trading Window closure pursuant to SEBI (Prohibition of Insider Trading) Regulations, 2015 as amended, the Company had earlier intimated closure of Trading Window from 30th Sept, 2019 to 9th November, 2019. In view of the Board Meeting being rescheduled on 12th November, 2019 the Trading Window will remain closed from 30th September, 2019 to 13th November, 2019.
Corporate Actions

No Upcoming Board Meetings

No Dividend history available

No Splits history available

No Bonus history available

No Rights history available
Quality key factors
Valuation key factors
Technicals key factors
 Technical Indicator Scale: Bearish, Mildly Bearish, Sideways, Mildly Bullish, Bullish Turned
 Shareholding Snapshot : Mar 2026
Shareholding Compare (%holding)
Promoters
None
Held by 9 Schemes (0.91%)
Held by 1 FIIs (3.07%)
Emerald Matrix Holdings Pte. Ltd (14.98%)
Bellona Hospitality Services Ltd. (8.77%)
6.64%
Quarterly Results Snapshot (Standalone) - Mar'26 - QoQ

QoQ Growth in quarter ended Mar 2026 is -134.45% vs -6.53% in Dec 2025
QoQ Growth in quarter ended Mar 2026 is -210.43% vs 132.58% in Dec 2025
Half Yearly Results Snapshot (Standalone) - Sep'25
Growth in half year ended Sep 2025 is 5.13% vs 16.35% in Sep 2024
Growth in half year ended Sep 2025 is -119.78% vs -20.94% in Sep 2024
Nine Monthly Results Snapshot (Standalone) - Dec'25

YoY Growth in nine months ended Dec 2025 is 39.30% vs -17.37% in Dec 2024
YoY Growth in nine months ended Dec 2025 is 114.86% vs -225.61% in Dec 2024
Annual Results Snapshot (Standalone) - Mar'26
YoY Growth in year ended Mar 2026 is -2.10% vs -15.45% in Mar 2025
YoY Growth in year ended Mar 2026 is 87.49% vs -233.36% in Mar 2025
About GKW Ltd

Company Coordinates


