Glenmark Pharma

  • Market Cap: Mid Cap
  • Industry: Pharmaceuticals & Biotechnology
  • ISIN: INE935A01035
  • NSEID: GLENMARK
  • BSEID: 532296
INR
2,458.75
18.75 (0.77%)
BSENSE

Aug 27, 11:34 AM

BSE+NSE Vol: 2.61 lacs

  • Price Points
  • Score
  • Mojo Parameters
  • Total Return
  • News and Corporate Actions
  • Key factors
  • Shareholding
  • Financials
  • CompanyCV
stock-summaryPrice Point
High/Low

1Day

52 Week

Valuation
Technical
Day's Volume

CASH

2.61 lacs (9.63%) Volume

Shareholding (Jun 2026)

FII

20.89%

Held by 376 FIIs

DII

18.65%

Held by 46 DIIs

Promoter

46.65%

Why is Glenmark Pharmaceuticals Ltd. falling/rising?

27-Aug-2026

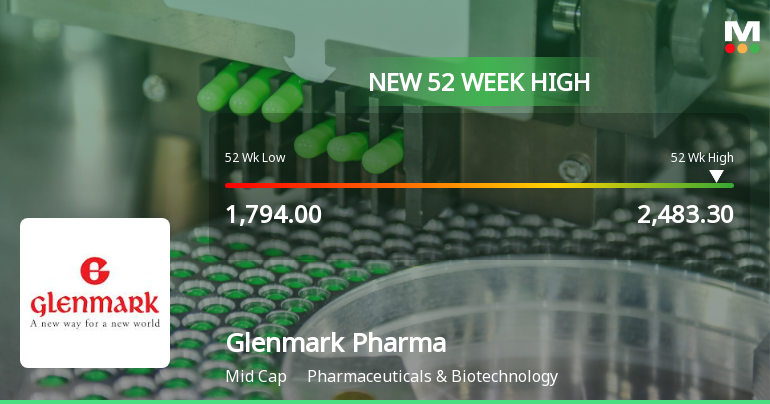
As of 26-Aug, Glenmark Pharmaceuticals Ltd. is seeing a stock price increase to 2,440.00, up 1.88%. This rise is driven by strong performance metrics, increased investor interest, and favorable financial ratios, significantly outperforming the benchmark Sensex.

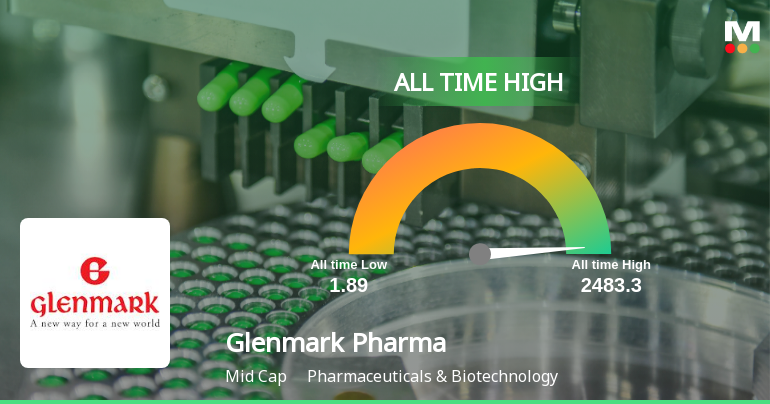
As of 26-Aug, Glenmark Pharmaceuticals Ltd. is experiencing a rise in its stock price, currently at 2,440.00, reflecting an increase of 45.0 (1.88%). This upward movement can be attributed to several positive factors. The stock has outperformed the benchmark Sensex, with a weekly return of +8.20% compared to the Sensex's +0.73%. Over the past month, Glenmark has shown an impressive return of +11.25%, while the Sensex has only increased by +1.86%. Year-to-date, the stock has gained +19.85%, significantly outperforming the Sensex, which is down -9.09%.<BR><BR>Additionally, Glenmark's stock is close to its 52-week high, just 1.27% away from Rs 2,471.05, and has been on a consecutive gain streak for the last three days, accumulating a total return of 5.81% during this period. The stock reached an intraday high of Rs 2,457.85, marking a rise of 2.62% for the day. It is also trading above its moving averages across various time frames, indicating a strong bullish trend.<BR><BR>Investor participation has increased, with a delivery volume of 2.9 lacs on August 25, which is up by 10.56% compared to the five-day average, suggesting growing interest in the stock. Furthermore, Glenmark has a low Debt to EBITDA ratio of 0.13 times, indicating a strong ability to service its debt, and a high return on equity (ROE) of 26.9, which contributes to its attractive valuation. The stock is trading at a discount relative to its peers, and its profits have risen significantly, with a PEG ratio of 0.1.<BR><BR>Overall, the combination of strong performance metrics, increasing investor interest, and favorable financial ratios contributes to the rising stock price of Glenmark Pharmaceuticals Ltd.

View full answer

Should I buy, sell or hold Glenmark Pharmaceuticals Ltd.?

26-Aug-2026

Who are in the management team of Glenmark Pharma?

14-Aug-2026

The management team of Glenmark Pharma includes Glenn Saldanha (Chairman/Executive Director), Cheryl Pinto (Executive Director), and V S Mani (Executive Director & Group CFO), along with several independent and non-executive directors who provide diverse expertise for the company's governance.

The management team of Glenmark Pharma includes the following key members:<BR><BR>1. **Glenn Saldanha** - Chairman / Executive Director<BR>2. **Cheryl Pinto** - Executive Director (Corporate)<BR>3. **V S Mani** - Executive Director & Group CFO<BR><BR>Additionally, the board features several independent and non-executive directors:<BR><BR>- **B E Saldanha** - Non-Executive Director<BR>- **Rajesh Desai** - Independent Non-Executive Director<BR>- **Devendra Raj Mehta** - Independent Non-Executive Director<BR>- **Bernard Munos** - Independent Non-Executive Director<BR>- **Brian W Tempest** - Independent Non-Executive Director<BR>- **Sridhar Gorthi** - Independent Non-Executive Director<BR>- **Sona Saira Ramasastry** - Independent Non-Executive Director<BR>- **Dipankar Bhattacharjee** - Independent Non-Executive Director<BR>- **V R Iyer** - Independent Non-Executive Director<BR><BR>This team brings a diverse range of expertise to the company, contributing to its strategic direction and governance.

View full answer

What does Glenmark Pharma do?

14-Aug-2026

Glenmark Pharmaceuticals Ltd. is a mid-cap company engaged in the discovery, development, manufacture, and marketing of pharmaceutical products. As of June 2026, it reported net sales of 4,018 Cr and a net profit of 483 Cr, with a market cap of INR 64,941 Cr.

Overview:<BR>Glenmark Pharmaceuticals Ltd. is a mid-cap company in the Pharmaceuticals & Biotechnology industry, focused on the discovery, development, manufacture, and marketing of pharmaceutical products.<BR><BR>History:<BR>Glenmark Pharmaceuticals Ltd. was incorporated on November 18th, 1977. The latest quarterly results reported net sales and net profit for the period ending June 2026.<BR><BR>Financial Snapshot:<BR>- Net Sales: 4,018 Cr (Quarterly Results - Jun 2026)<BR>- Net Profit: 483 Cr (Quarterly Results - Jun 2026)<BR>- Market Cap: INR 64,941 Cr (Mid Cap)<BR><BR>Key Metrics:<BR>- P/E: 21.00<BR>- Industry P/E: 37<BR>- Dividend Yield: 0.22%<BR>- Debt-Equity: -0.06<BR>- Return on Equity: 26.86%<BR>- Price to Book: 6.10<BR><BR>Contact Details:<BR>- Address: B/2 Mahalaxmi Chambers, 22 Bhulabhai Desai Road, Mumbai, Maharashtra: 400026<BR>- Tel: 91-22-40189999<BR>- Email: complianceofficer@glenmarkpharma.co<BR>- Website: http://www.glenmarkpharma.com

View full answer

Who are the peers of the Glenmark Pharma?

14-Aug-2026

Glenmark Pharma's peers include Laurus Labs, Dr Reddy's Labs, Aurobindo Pharma, Biocon, Alkem Lab, Abbott India, Anthem Bioscienc, Gland Pharma, and Ipca Labs. In terms of performance, Laurus Labs leads with a 1-year return of 113.22%, while Glenmark Pharma has a return of 12.92%.

Peers: Glenmark Pharma's peers include Laurus Labs, Dr Reddy's Labs, Aurobindo Pharma, Biocon, Alkem Lab, Abbott India, Anthem Bioscienc, Gland Pharma, and Ipca Labs.<BR><BR>Quality Snapshot: Excellent management risk is observed at Dr Reddy's Labs and Abbott India, while Good management risk is found at Laurus Labs, Alkem Lab, Anthem Bioscienc, Gland Pharma, Ipca Labs, and Glenmark Pharma, and Average management risk is noted at Aurobindo Pharma and Biocon. For Growth, Excellent growth is seen at Anthem Bioscienc, Average growth at Dr Reddy's Labs and Abbott India, and Below Average growth at Laurus Labs, Aurobindo Pharma, Alkem Lab, Biocon, Gland Pharma, and Ipca Labs. In terms of Capital Structure, Excellent capital structure is noted at Dr Reddy's Labs, Aurobindo Pharma, Alkem Lab, Abbott India, Anthem Bioscienc, Gland Pharma, and Ipca Labs, while Glenmark Pharma has a Good capital structure and Laurus Labs, Biocon, and Alkem Lab have an Average capital structure.<BR><BR>Return Snapshot: The peer with the highest 1-year return is Laurus Labs at 113.22%, while Abbott India has the lowest at -16.28%. Glenmark Pharma's 1-year return of 12.92% is higher than Abbott India's but lower than Laurus Labs'. Additionally, Abbott India and Dr Reddy's Labs have negative six-month returns.

View full answer

How big is Glenmark Pharma?

14-Aug-2026

As of 14th August, Glenmark Pharmaceuticals Ltd. has a market capitalization of 65,550.00 Cr, with net sales of 17,736.56 Cr and a net profit of 1,797.89 Cr over the latest four quarters.

As of 14th August, <BR><BR>Market Cap: Glenmark Pharmaceuticals Ltd. has a market capitalization of 65,550.00 Cr, categorizing it as a Mid Cap company.<BR><BR>Recent Quarterly Performance: The sum of Net Sales for the latest 4 quarters is 17,736.56 Cr, while the sum of Net Profit for the same period is 1,797.89 Cr.<BR><BR>Balance Sheet Snapshot: The reporting period for the latest annual data is March 2025. Shareholder's Funds are valued at 8,849.44 Cr, and Total Assets amount to 14,925.44 Cr.

View full answer

When is the next results date for Glenmark Pharmaceuticals Ltd.?

16-Jul-2026

The next results date for Glenmark Pharmaceuticals Ltd. is 31 July 2026.

The next results date for Glenmark Pharmaceuticals Ltd. is scheduled for 31 July 2026.

View full answer

Are Glenmark Pharmaceuticals Ltd. latest results good or bad?

03-Jun-2026

Glenmark Pharmaceuticals Ltd.'s latest results show strong year-on-year growth with a net profit increase of 6,381.94% and net sales up 15.80%. However, there are concerns due to sequential declines in both profit and sales, indicating potential volatility in performance.

Glenmark Pharmaceuticals Ltd.'s latest results present a mixed picture. For the quarter ending March 2026, the company reported a net profit of ₹301.41 crores, which reflects a significant year-on-year increase of 6,381.94%. However, this represents a decline of 25.25% compared to the previous quarter, raising concerns about the sustainability of its recent performance.<BR><BR>Net sales for the same quarter were ₹3,770.59 crores, showing a 15.80% increase year-on-year, but a decrease of 3.33% from the previous quarter. This sequential decline follows an unusually strong performance in Q3 FY26, which had benefited from one-time gains.<BR><BR>Operating margins also contracted to 20.28%, down from 22.37% in the previous quarter, indicating some pressure on profitability. Despite these challenges, the company's return on capital employed (ROCE) reached an impressive 40.16%, the highest level recorded in recent periods, suggesting strong operational efficiency.<BR><BR>Overall, while Glenmark's year-on-year growth is commendable, the sequential declines in both net profit and sales indicate potential volatility and questions about the underlying business momentum. Investors may want to consider these factors when evaluating the company's performance.

View full answer

Is Glenmark Pharma overvalued or undervalued?

18-Nov-2025

As of November 17, 2025, Glenmark Pharma is considered undervalued with a PE ratio of 23.47 and strong growth potential, outperforming peers like Sun Pharma and Cipla, and has delivered a 21.44% return over the past year compared to the Sensex's 9.50%.

As of 17 November 2025, Glenmark Pharma's valuation grade has moved from expensive to attractive, indicating a shift in market perception. The company is currently considered undervalued. Key ratios supporting this assessment include a PE ratio of 23.47, an EV to EBITDA of 12.50, and a PEG ratio of 0.04, which suggests strong growth potential relative to its price.<BR><BR>In comparison to its peers, Glenmark Pharma's valuation metrics stand out; for instance, Sun Pharma has a significantly higher PE ratio of 36.69, while Cipla, another attractive peer, has a PE of 22.81. This positions Glenmark favorably within the industry, particularly given its robust ROCE of 44.14% and ROE of 23.46%. Additionally, Glenmark's stock has outperformed the Sensex over the past year, with a return of 21.44% compared to the Sensex's 9.50%, reinforcing the attractiveness of its current valuation.

View full answer

How has been the historical performance of Glenmark Pharma?

15-Nov-2025

Glenmark Pharma's historical performance shows significant fluctuations, with net sales increasing to 13,321.74 Cr in Mar'25 after a dip in Mar'23, and a recovery in profit after tax to 1,047.14 Cr in Mar'25 from a loss of 1,830.85 Cr in the previous year. Despite negative cash flow from operating activities in Mar'25, the company demonstrates a recovery trajectory following a challenging period.

Answer:<BR>The historical performance of Glenmark Pharma shows significant fluctuations in key financial metrics over the years.<BR><BR>Breakdown:<BR>Glenmark Pharma's net sales increased from 10,640.97 Cr in Mar'20 to 13,321.74 Cr in Mar'25, with a notable dip in Mar'23 at 12,990.11 Cr. Total operating income followed a similar trend, reaching 13,321.74 Cr in Mar'25. The total expenditure, excluding depreciation, rose from 8,279.66 Cr in Mar'19 to 10,970.36 Cr in Mar'25. Operating profit (PBDIT) saw fluctuations, peaking at 2,595.16 Cr in Mar'23 before declining to 2,465.10 Cr in Mar'25. Profit before tax was 1,399.21 Cr in Mar'25, recovering from a low of 36.50 Cr in Mar'24. The profit after tax turned positive at 1,047.14 Cr in Mar'25 after a significant loss of 1,830.85 Cr in the previous year. The earnings per share (EPS) rebounded to 37.1 in Mar'25 from a negative EPS of -53.21 in Mar'24. Total assets increased to 14,925.44 Cr in Mar'25, while total liabilities also rose to 14,925.44 Cr, indicating a balanced growth in the company’s financial structure. Cash flow from operating activities was negative at -827.00 Cr in Mar'25, contrasting with a positive cash flow of 782.00 Cr in Mar'24. Overall, Glenmark Pharma's financial performance reflects a recovery trajectory in 2025 after a challenging previous year.

View full answer

Is Glenmark Pharma technically bullish or bearish?

11-Sep-2025

As of September 10, 2025, Glenmark Pharma's trend is mildly bullish, supported by daily moving averages and weekly Bollinger Bands, but tempered by mixed signals from the MACD and OBV.

As of 10 September 2025, the technical trend for Glenmark Pharma has changed from bullish to mildly bullish. The current stance is mildly bullish, driven by the daily moving averages indicating bullish momentum and the weekly Bollinger Bands also showing bullish signals. However, the weekly MACD is mildly bearish and the KST is bullish on a weekly basis but mildly bearish on a monthly basis, suggesting some mixed signals. The Dow Theory indicates a mildly bullish stance on the weekly chart, while the OBV shows a mildly bearish trend. Overall, the strength of the bullish sentiment is tempered by the mixed indicators, particularly on the weekly timeframe.

View full answer

Who are the top shareholders of the Glenmark Pharma?

17-Jul-2025

The top shareholders of Glenmark Pharma include the Saldanha Family Trust with 45.45%, institutional investors holding 36.02% (including 25 mutual fund schemes at 12.86% and 347 FIIs at 23.16%), and individual investors with 12.32%. HDFC Mutual Fund is the largest public shareholder with a 4.27% stake.

The top shareholders of Glenmark Pharma include the Saldanha Family Trust, which holds the largest stake at 45.45%. The company also has significant institutional backing, with 25 mutual fund schemes collectively holding 12.86% and 347 foreign institutional investors (FIIs) holding 23.16%. Additionally, HDFC Mutual Fund, specifically through the HDFC Nifty Large Midcap 250 Index fund, is the highest public shareholder with a 4.27% stake. Individual investors collectively own 12.32% of the company.

View full answer

Has Glenmark Pharma declared dividend?

06-Jun-2025

Yes, Glenmark Pharmaceuticals has declared a 250% dividend, amounting to ₹2.5 per share, with an ex-date of September 13, 2024. The company has shown strong total returns over various periods, particularly in the long term.

Glenmark Pharmaceuticals Ltd. has declared a 250% dividend.<BR><BR>Dividend Details:<BR>- Percentage announced: 250%<BR>- Amount per share: 2.5<BR>- Ex-date: 13 Sep 24<BR><BR>Dividend Yield: 0.16%.<BR><BR>Total Returns by Period:<BR>In the last 6 months, the price return was 3.97%, with no dividend return, resulting in a total return of 3.97%.<BR><BR>Over the past year, the price return was 31.68%, with a dividend return of 0.21%, leading to a total return of 31.89%.<BR><BR>In the 2-year period, the price return was 152.58%, with a dividend return of 0.78%, culminating in a total return of 153.36%.<BR><BR>For the 3-year period, the price return was 305.84%, with a dividend return of 2.04%, resulting in a total return of 307.88%.<BR><BR>In the last 4 years, the price return was 159.41%, with a dividend return of 1.50%, giving a total return of 160.91%.<BR><BR>Over the 5-year period, the price return was 295.81%, with a dividend return of 2.87%, leading to a total return of 298.68%.<BR><BR>Overall, Glenmark Pharma has declared a substantial dividend, and the total returns over various periods indicate strong price appreciation, particularly over the longer term, suggesting a positive performance trend for the company.

View full answer
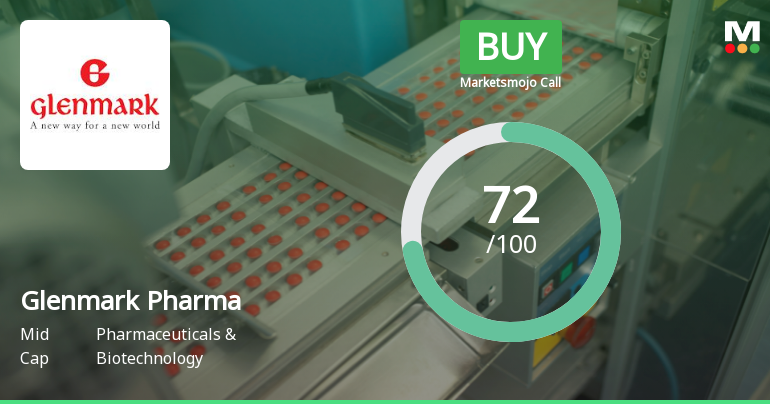
iScoreScore
Part of MojoOne Strategy
Click here to find our call on this stock
Strong Sell
Sell
Hold
Buy
Strong Buy

Dashboard

1

Strong ability to service debt as the company has a low Debt to EBITDA ratio of 0.13 times

 
2

With ROE of 26.9, it has a Attractive valuation with a 6.6 Price to Book Value

3

High Institutional Holdings at 39.54%

4

Company is among the highest 1% of companies rated by MarketsMojo across all 4,000 stocks

 
5

Consistent Returns over the last 3 years

stock-summaryMojo Parameters

Mojo Parameters

Loading Valuation Snapshot...

Stock DNA

stock-summary
Industry

Pharmaceuticals & Biotechnology

stock-summary
Market cap

INR 69,392 Cr (Mid Cap)

stock-summary
P/E

22.00

stock-summary
Industry P/E

37

stock-summary
Dividend Yield

0.20%

stock-summary
Debt Equity

-0.06

stock-summary
Return on Equity

26.86%

stock-summary
Price to Book

6.55

Revenue and Profits:
Net Sales:
4,018 Cr
(Quarterly Results - Jun 2026)
Net Profit:
483 Cr
stock-summaryTotal Returns
Total Returns (Price + Dividend) stock-summary
Dividend Yield (0.2%)
TimePeriod
Price Return
Dividend Return
Total Return
3 Months
3.19%
0.11%
3.3%
6 Months
15.02%
0.12%
15.14%
1 Year
25.93%
0.39%
26.32%
2 Years
44.06%
0.59%
44.65%
3 Years
232.51%
1.54%
234.05%
4 Years
551.84%
3.37%
555.21%
5 Years
375.81%
2.93%
378.74%

Latest dividend: 2.5 per share ex-dividend date: Oct-03-2025

Risk Adjusted Returns v/s stock-summary
Returns Beta
Icon
Beta has not been calculated since enough price history is not available
stock-summaryNews & Corporate Actions

Announcements stock-summary

Announcement under Regulation 30 (LODR)-Press Release / Media Release

21-Aug-2026 | Source : BSE

Glenmark Pharmaceuticals Inc. USA launches Calcium Gluconate Injection USP 1000 mg/10 mL (100 mg/mL) 5000 mg/50 mL (100 mg/mL) Single-Dose Vials and 10000 mg/100 mL (100 mg/mL) Pharmacy Bulk Package

Announcement under Regulation 30 (LODR)-Press Release / Media Release

20-Aug-2026 | Source : BSE

Glenmark Pharmaceuticals receives U.S. FDA approval for Fluticasone Propionate Nasal Spray 0.05 mg (50 mcg)/spray

Announcement under Regulation 30 (LODR)-Newspaper Publication

15-Aug-2026 | Source : BSE

Newspaper Advertisement regarding the 48th Annual General Meeting ("AGM") to be held on Friday September 11 2026 at 2.00 p.m. through Video Conferencing ("VC") / Other Audio-Visual Means ("OAVM")

Corporate Actions stock-summary

stock-summary
BOARD MEETING

No Upcoming Board Meetings

stock-summary
DIVIDEND

Glenmark Pharmaceuticals Ltd. has declared 250% dividend, ex-date: 31 Aug 26

stock-summary
SPLITS

Glenmark Pharmaceuticals Ltd. has announced 1:2 stock split, ex-date: 10 Sep 07

stock-summary
BONUS

No Bonus history available

stock-summary
RIGHTS

No Rights history available

stock-summaryKey Factors

Quality key factors stock-summary

Factor
Value
Sales Growth (5y)
8.93%
EBIT Growth (5y)
19.21%
EBIT to Interest (avg)
8.05
Debt to EBITDA (avg)
1.37
Net Debt to Equity (avg)
-0.06
Sales to Capital Employed (avg)
1.12
Tax Ratio
29.01%
Dividend Payout Ratio
6.74%
Pledged Shares
0
Institutional Holding
39.54%
ROCE (avg)
19.22%
ROE (avg)
12.43%

Valuation key factors

Factor
Value
P/E Ratio
22
Industry P/E
37
Price to Book Value
6.55
EV to EBIT
16.34
EV to EBITDA
14.23
EV to Capital Employed
6.88
EV to Sales
3.85
PEG Ratio
0.13
Dividend Yield
0.20%
ROCE (Latest)
40.27%
ROE (Latest)
26.86%

Technicals key factors

Indicator
Weekly
Monthly
MACD
Bullish
Bullish
RSI
No Signal
No Signal
Bollinger Bands
Bullish
Bullish
Moving Averages
Bullish (Daily)
KST
Mildly Bearish
Mildly Bearish
Dow Theory
Mildly Bullish
Mildly Bullish
OBV
Mildly Bullish
Mildly Bullish
stock-summary Technical Indicator Scale: Bearish, Mildly Bearish, Sideways, Mildly Bullish, Bullish  Turned 
stock-summaryShareholding
Shareholding Snapshot : Jun 2026stock-summary
Shareholding Compare (%holding) stock-summary
Majority shareholders

Promoters

Pledged Promoter Holdings

None

Mutual Funds

Held by 37 Schemes (16.76%)

FIIs

Held by 376 FIIs (20.89%)

Promoter with highest holding

Saldanha Family Trust (45.44%)

Highest Public shareholder

Hdfc Mutual Fund - Hdfc Mid-cap Fund (6.22%)

Individual Investors Holdings

10.6%

stock-summaryFinancial
[
  {
    "link": "quarterly",
    "btn_text": "All Quarterly Results",
    "header": "Quarterly Results Snapshot (Consolidated) - Jun'26 - QoQ",
    "rhs": [
      {
        "prefix": "Net Sales ",
        "suffix": "QoQ Growth in quarter ended Jun 2026 is 6.57% vs -3.33% in Mar 2026",
        "dir": 1
      },
      {
        "prefix": "Consolidated Net Profit ",
        "suffix": "QoQ Growth in quarter ended Jun 2026 is 60.22% vs -25.25% in Mar 2026",
        "dir": 1
      }
    ],
    "table": {
      "header": [
        "Jun'26",
        "Mar'26",
        "Change(%)"
      ],
      "body": [
        {
          "field": "Net Sales",
          "val1": "4,018.48",
          "val2": "3,770.59",
          "chgp": "6.57%",
          "chgp_class": "positive"
        },
        {
          "field": "Operating Profit (PBDIT) excl Other Income",
          "val1": "804.79",
          "val2": "762.60",
          "chgp": "5.53%",
          "chgp_class": "positive"
        },
        {
          "field": "Interest",
          "val1": "54.00",
          "val2": "42.60",
          "chgp": "26.76%",
          "chgp_class": "negative"
        },
        {
          "field": "Exceptional Items",
          "val1": "0.00",
          "val2": "-373.40",
          "chgp": "100.00%",
          "chgp_class": "positive"
        },
        {
          "field": "Consolidate Net Profit",
          "val1": "482.92",
          "val2": "301.41",
          "chgp": "60.22%",
          "chgp_class": "positive"
        },
        {
          "field": "Operating Profit Margin (Excl OI)",
          "val1": "20.47%",
          "val2": "20.28%",
          "chgp": "0.19%",
          "chgp_class": "positive"
        }
      ]
    }
  },
  {
    "link": "half-yearly",
    "btn_text": "All Half Yearly Results",
    "header": "Half Yearly Results Snapshot (Consolidated) - Sep'25",
    "rhs": [
      {
        "prefix": "Net Sales ",
        "suffix": " Growth in half year ended Sep 2025 is 39.43% vs 6.96% in Sep 2024",
        "dir": 1
      },
      {
        "prefix": "Consolidated Net Profit ",
        "suffix": " Growth in half year ended Sep 2025 is -5.37% vs 921.44% in Sep 2024",
        "dir": -1
      }
    ],
    "table": {
      "header": [
        "Sep'25",
        "Sep'24",
        "Change(%)"
      ],
      "body": [
        {
          "field": "Net Sales",
          "val1": "9,311.31",
          "val2": "6,677.98",
          "chgp": "39.43%",
          "chgp_class": "positive"
        },
        {
          "field": "Operating Profit (PBDIT) excl Other Income",
          "val1": "2,940.07",
          "val2": "1,190.13",
          "chgp": "147.04%",
          "chgp_class": "positive"
        },
        {
          "field": "Interest",
          "val1": "124.69",
          "val2": "88.06",
          "chgp": "41.60%",
          "chgp_class": "negative"
        },
        {
          "field": "Exceptional Items",
          "val1": "-1,708.35",
          "val2": "0.00",
          "chgp": "",
          "chgp_class": "neutral"
        },
        {
          "field": "Consolidate Net Profit",
          "val1": "657.22",
          "val2": "694.48",
          "chgp": "-5.37%",
          "chgp_class": "negative"
        },
        {
          "field": "Operating Profit Margin (Excl OI)",
          "val1": "32.44%",
          "val2": "17.97%",
          "chgp": "14.47%",
          "chgp_class": "positive"
        }
      ]
    }
  },
  {
    "link": "nine-monthly",
    "btn_text": "All Nine Monthly Results",
    "header": "Nine Monthly Results Snapshot (Consolidated) - Dec'25",
    "rhs": [
      {
        "prefix": "Net Sales ",
        "suffix": "YoY Growth in nine months ended Dec 2025 is 31.26% vs 15.03% in Dec 2024",
        "dir": 1
      },
      {
        "prefix": "Consolidated Net Profit ",
        "suffix": "YoY Growth in nine months ended Dec 2025 is 1.73% vs 467.86% in Dec 2024",
        "dir": -1
      }
    ],
    "table": {
      "header": [
        "Dec'25",
        "Dec'24",
        "Change(%)"
      ],
      "body": [
        {
          "field": "Net Sales",
          "val1": "13,211.93",
          "val2": "10,065.53",
          "chgp": "31.26%",
          "chgp_class": "positive"
        },
        {
          "field": "Operating Profit (PBDIT) excl Other Income",
          "val1": "3,809.83",
          "val2": "1,790.36",
          "chgp": "112.80%",
          "chgp_class": "positive"
        },
        {
          "field": "Interest",
          "val1": "166.12",
          "val2": "140.35",
          "chgp": "18.36%",
          "chgp_class": "negative"
        },
        {
          "field": "Exceptional Items",
          "val1": "-1,892.69",
          "val2": "0.00",
          "chgp": "",
          "chgp_class": "neutral"
        },
        {
          "field": "Consolidate Net Profit",
          "val1": "1,060.43",
          "val2": "1,042.44",
          "chgp": "1.73%",
          "chgp_class": "positive"
        },
        {
          "field": "Operating Profit Margin (Excl OI)",
          "val1": "28.84%",
          "val2": "17.79%",
          "chgp": "11.05%",
          "chgp_class": "positive"
        }
      ]
    }
  },
  {
    "link": "annual",
    "btn_text": "All Annual Results",
    "header": "Annual Results Snapshot (Consolidated) - Mar'26",
    "rhs": [
      {
        "prefix": "Net Sales ",
        "suffix": "YoY Growth in year ended Mar 2026 is 27.48% vs 12.77% in Mar 2025",
        "dir": 1
      },
      {
        "prefix": "Consolidated Net Profit ",
        "suffix": "YoY Growth in year ended Mar 2026 is 30.06% vs 169.73% in Mar 2025",
        "dir": -1
      }
    ],
    "table": {
      "header": [
        "Mar'26",
        "Mar'25",
        "Change(%)"
      ],
      "body": [
        {
          "field": "Net Sales",
          "val1": "16,982.51",
          "val2": "13,321.74",
          "chgp": "27.48%",
          "chgp_class": "positive"
        },
        {
          "field": "Operating Profit (PBDIT) excl Other Income",
          "val1": "4,572.41",
          "val2": "2,351.38",
          "chgp": "94.46%",
          "chgp_class": "positive"
        },
        {
          "field": "Interest",
          "val1": "208.73",
          "val2": "207.07",
          "chgp": "0.80%",
          "chgp_class": "negative"
        },
        {
          "field": "Exceptional Items",
          "val1": "-2,266.08",
          "val2": "-372.82",
          "chgp": "-507.82%",
          "chgp_class": "negative"
        },
        {
          "field": "Consolidate Net Profit",
          "val1": "1,361.85",
          "val2": "1,047.10",
          "chgp": "30.06%",
          "chgp_class": "positive"
        },
        {
          "field": "Operating Profit Margin (Excl OI)",
          "val1": "27.36%",
          "val2": "17.89%",
          "chgp": "9.47%",
          "chgp_class": "positive"
        }
      ]
    }
  }
]

Quarterly Results Snapshot (Consolidated) - Jun'26 - QoQstock-summary

Jun'26
Mar'26
Change(%)
Net Sales
4,018.48
3,770.59
6.57%
Operating Profit (PBDIT) excl Other Income
804.79
762.60
5.53%
Interest
54.00
42.60
26.76%
Exceptional Items
0.00
-373.40
100.00%
Consolidate Net Profit
482.92
301.41
60.22%
Operating Profit Margin (Excl OI)
20.47%
20.28%
0.19%
Values in Rs Cr.
Direction Arrows
Net Sales

QoQ Growth in quarter ended Jun 2026 is 6.57% vs -3.33% in Mar 2026

Direction Arrows
Consolidated Net Profit

QoQ Growth in quarter ended Jun 2026 is 60.22% vs -25.25% in Mar 2026

Half Yearly Results Snapshot (Consolidated) - Sep'25stock-summary

Sep'25
Sep'24
Change(%)
Net Sales
9,311.31
6,677.98
39.43%
Operating Profit (PBDIT) excl Other Income
2,940.07
1,190.13
147.04%
Interest
124.69
88.06
41.60%
Exceptional Items
-1,708.35
0.00
Consolidate Net Profit
657.22
694.48
-5.37%
Operating Profit Margin (Excl OI)
32.44%
17.97%
14.47%
Values in Rs Cr.
Direction Arrows
Net Sales

Growth in half year ended Sep 2025 is 39.43% vs 6.96% in Sep 2024

Direction Arrows
Consolidated Net Profit

Growth in half year ended Sep 2025 is -5.37% vs 921.44% in Sep 2024

Nine Monthly Results Snapshot (Consolidated) - Dec'25stock-summary

Dec'25
Dec'24
Change(%)
Net Sales
13,211.93
10,065.53
31.26%
Operating Profit (PBDIT) excl Other Income
3,809.83
1,790.36
112.80%
Interest
166.12
140.35
18.36%
Exceptional Items
-1,892.69
0.00
Consolidate Net Profit
1,060.43
1,042.44
1.73%
Operating Profit Margin (Excl OI)
28.84%
17.79%
11.05%
Values in Rs Cr.
Direction Arrows
Net Sales

YoY Growth in nine months ended Dec 2025 is 31.26% vs 15.03% in Dec 2024

Direction Arrows
Consolidated Net Profit

YoY Growth in nine months ended Dec 2025 is 1.73% vs 467.86% in Dec 2024

Annual Results Snapshot (Consolidated) - Mar'26stock-summary

Mar'26
Mar'25
Change(%)
Net Sales
16,982.51
13,321.74
27.48%
Operating Profit (PBDIT) excl Other Income
4,572.41
2,351.38
94.46%
Interest
208.73
207.07
0.80%
Exceptional Items
-2,266.08
-372.82
-507.82%
Consolidate Net Profit
1,361.85
1,047.10
30.06%
Operating Profit Margin (Excl OI)
27.36%
17.89%
9.47%
Values in Rs Cr.
Direction Arrows
Net Sales

YoY Growth in year ended Mar 2026 is 27.48% vs 12.77% in Mar 2025

Direction Arrows
Consolidated Net Profit

YoY Growth in year ended Mar 2026 is 30.06% vs 169.73% in Mar 2025

stock-summaryCompany CV
About Glenmark Pharmaceuticals Ltd. stock-summary
stock-summary
Glenmark Pharmaceuticals Ltd.
Mid Cap
Pharmaceuticals & Biotechnology
Glenmark Pharmaceuticals Limited was incorporated on November 18, 1977. The Company is actively involved in the discovery of new molecules both NCEs (new chemical entity) and NBEs (new biological entity). It is engaged in the business of development, manufacture and marketing of pharmaceutical products both formulation and active pharmaceuticals ingredients to regulated and semi-regulated markets.
Company Coordinates stock-summary
Company Details
B/2 Mahalaxmi Chambers, 22 Bhulabhai Desai Road Mumbai Maharashtra : 400026
stock-summary
Tel: 91-22-40189999
stock-summary
complianceofficer@glenmarkpharma.co
Registrar Details
Karvy Computershare Pvt Ltd, Plot No 17-24 , Near Image Hospital,, Reliance Cybervilae,Vithalrao Nagar,, Madhapur, Hyderabad