
Compare Global Offshore with Similar Stocks
Dashboard
Weak Long Term Fundamental Strength with an average Return on Capital Employed (ROCE) of 0%
- Poor long term growth as Net Sales has grown by an annual rate of -17.80% and Operating profit at -9.36% over the last 5 years
- Low ability to service debt as the company has a high Debt to EBITDA ratio of -1.00 times
The company has declared Negative results for the last 3 consecutive quarters
Risky - Negative Operating Profits
Underperformed the market in the last 1 year
Stock DNA
Transport Services
INR 125 Cr (Micro Cap)
NA (Loss Making)
10
0.00%
0.39
-8.95%
0.92
Total Returns (Price + Dividend) 
Latest dividend: 1.2 per share ex-dividend date: Sep-16-2014
Risk Adjusted Returns v/s
Returns Beta

News
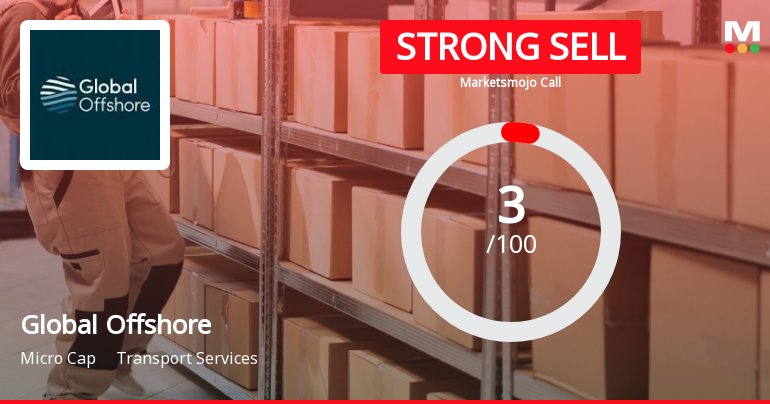
Global Offshore Services Ltd is Rated Strong Sell
Global Offshore Services Ltd is rated Strong Sell by MarketsMOJO. This rating was last updated on 09 June 2025, reflecting a significant reassessment of the stock’s outlook. However, the analysis and financial metrics presented here are based on the company’s current position as of 26 March 2026, providing investors with the latest insights into its performance and prospects.
Read full news article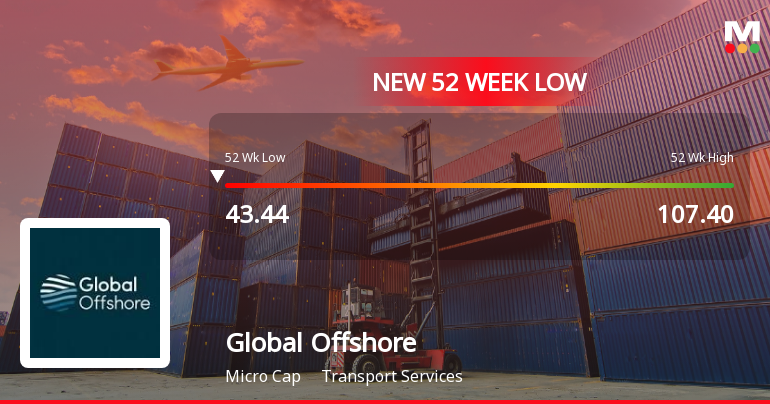
Five Consecutive Losses Push Global Offshore Services Ltd to a New 52-Week Low
For the fifth straight session, Global Offshore Services Ltd closed lower, breaching its 52-week low at Rs 42.1 on 24 Mar 2026, marking a 12.13% decline over this losing streak and extending its year-long slide to over 53%. This persistent downtrend contrasts sharply with the broader market's recent attempts at stabilisation.
Read full news article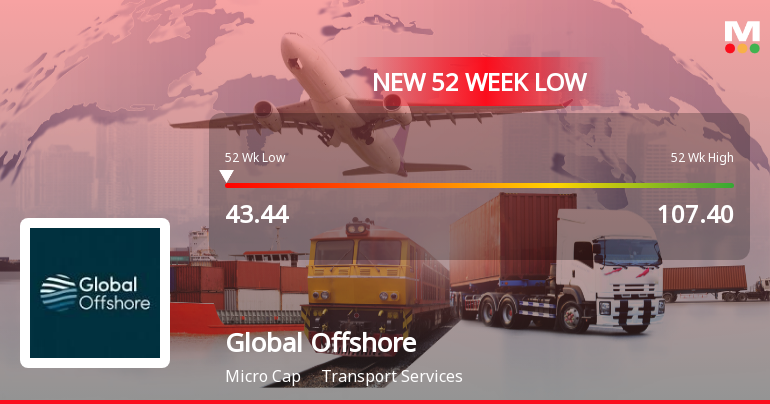
Global Offshore Services Ltd Falls to 52-Week Low of Rs 43 as Sell-Off Deepens
For the second consecutive session, Global Offshore Services Ltd has succumbed to selling pressure, hitting a fresh 52-week low of Rs 43 on 23 Mar 2026. This decline extends the stock’s recent losing streak, with a cumulative fall of over 10% in just two days, underscoring the challenges facing the company amid a broadly weak market backdrop.
Read full news article Announcements
Announcement under Regulation 30 (LODR)-Change of Company Name
18-Feb-2026 | Source : BSEPursuant to Regulation 30 of Securities and Exchange Board of India (Listing Obligations and Disclosure Requirements) Regulations 2015 we hereby inform that Government of India Ministry of Corporate Affairs has issued a Certificate of Incorporation dated 18.02.2026 (copy enclosed) pursuant to change of name from Global Offshore Services Ltd. to Garware Offshore Services Limited.
Board Meeting Outcome for OUTCOME OF THE BOARD MEETING DATED FEBRUARY 12 2026
12-Feb-2026 | Source : BSEThis is to inform that at the meeting of the Board of Directors of the Company held today the following items were considered and approved. 1] Pursuant to provisions of SEBI (Listing Obligations and Disclosure Requirements) Regulations 2015 we enclose the copy of Un-audited Standalone and Consolidated Financial Results for the quarter and nine months ended 31st December 2025 taken on record by the Board of Directors today alongwith the Limited Review Report for the quarter ended 31st December 2025 issued by Statutory Auditors of the Company. 2] To defer filing of Application to National Stock Exchange of India Ltd. (NSE) for listing of Share till May 2026 in view of the fact that a particular criteria is not being met presently and is expected to be met by the end of F.Y. 2025-26.
Shareholder Meeting / Postal Ballot-Scrutinizers Report
06-Feb-2026 | Source : BSEWe enclose herewith Report of the Scrutinizer dated 06th February 2026 (Form No. MGT - 13 ) issued by M/S Taher Sapatwala & Associates Practicing Company Secretary in connection with the remote e-voting done in the Postal Ballot process for your information and records.
Corporate Actions

No Upcoming Board Meetings

Global Offshore Services Ltd has declared 12% dividend, ex-date: 16 Sep 14

No Splits history available

No Bonus history available

No Rights history available
Quality key factors
Valuation key factors
Technicals key factors
 Technical Indicator Scale: Bearish, Mildly Bearish, Sideways, Mildly Bullish, Bullish Turned
 Shareholding Snapshot : Dec 2025
Shareholding Compare (%holding)
Non Institution
None
Held by 4 Schemes (0.1%)
Held by 3 FIIs (0.16%)
Sushma Ashok Garware (7.9%)
Shri Krishna Welfare Trust (2.54%)
46.68%
Quarterly Results Snapshot (Consolidated) - Dec'25 - YoY

YoY Growth in quarter ended Dec 2025 is 50.55% vs 3.04% in Dec 2024

YoY Growth in quarter ended Dec 2025 is -120.88% vs 401.26% in Dec 2024
Half Yearly Results Snapshot (Consolidated) - Sep'25
Growth in half year ended Sep 2025 is -29.67% vs -33.67% in Sep 2024
Growth in half year ended Sep 2025 is 58.19% vs 47.63% in Sep 2024
Nine Monthly Results Snapshot (Consolidated) - Dec'25
YoY Growth in nine months ended Dec 2025 is -2.23% vs -24.47% in Dec 2024
YoY Growth in nine months ended Dec 2025 is -167.58% vs 149.95% in Dec 2024
Annual Results Snapshot (Consolidated) - Mar'25
YoY Growth in year ended Mar 2025 is -16.48% vs -23.13% in Mar 2024
YoY Growth in year ended Mar 2025 is -89.81% vs -88.65% in Mar 2024
About Global Offshore Services Ltd

Company Coordinates


