
Compare Glottis with Similar Stocks
Stock DNA
Transport Services
INR 593 Cr (Micro Cap)
16.00
33
0.00%
-0.17
13.42%
2.20
Total Returns (Price + Dividend) 
Glottis for the last several years.
Risk Adjusted Returns v/s
Returns Beta

News

Glottis Ltd Technical Momentum Shifts Amid Mixed Indicator Signals
Glottis Ltd, a micro-cap player in the Transport Services sector, has experienced a notable shift in its technical momentum, moving from a mildly bullish stance to a sideways trend. Despite a robust price gain of 3.91% on 10 Jun 2026, the stock’s technical indicators present a complex picture, with bullish signals on some fronts and bearish cues on others, prompting a downgrade in its Mojo Grade from Hold to Sell.
Read full news article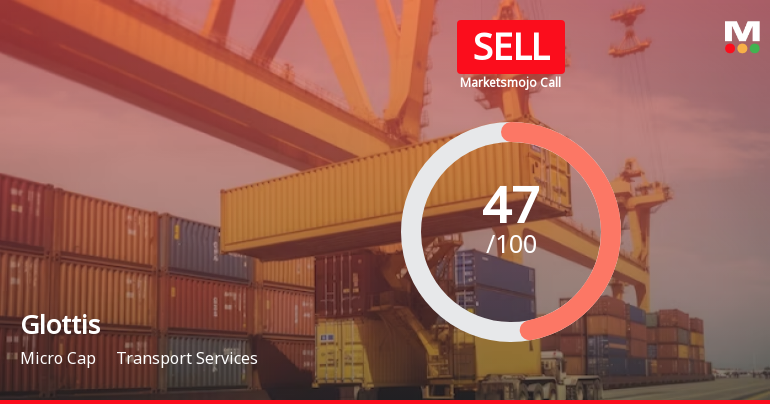
Glottis Ltd is Rated Sell
Glottis Ltd is rated Sell by MarketsMOJO, with this rating last updated on 26 May 2026. However, the analysis and financial metrics presented here reflect the stock’s current position as of 09 June 2026, providing investors with the most up-to-date view of the company’s fundamentals, returns, and technical outlook.
Read full news article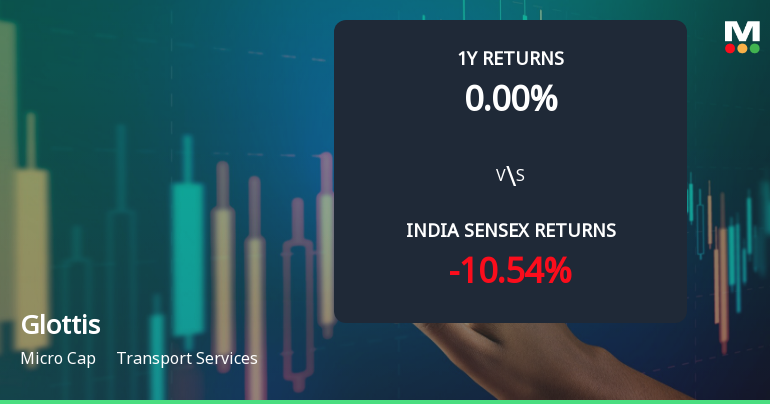
Glottis Ltd Technical Momentum Shifts Amid Mixed Market Signals
Glottis Ltd, a micro-cap player in the transport services sector, has experienced a subtle shift in its technical momentum, moving from a sideways trend to a mildly bullish stance. Despite a recent downgrade in its Mojo Grade from Hold to Sell, the stock’s technical indicators present a complex picture, with bullish signals on the weekly MACD and Bollinger Bands contrasting with bearish RSI readings. This article analyses these technical parameters in detail, alongside price action and market context, to provide a comprehensive view for investors.
Read full news article Announcements
Announcement under Regulation 30 (LODR)-Earnings Call Transcript
01-Jun-2026 | Source : BSEGlottis Limited has informed the Exchange about Transcript of the earnings call held on May 26 2026.
Compliances-Reg.24(A)-Annual Secretarial Compliance
29-May-2026 | Source : BSEAnnual Secretarial Compliance Report for the Financial Year ended 31st March 2026.
Announcement under Regulation 30 (LODR)-Analyst / Investor Meet - Outcome
26-May-2026 | Source : BSEGlottis Limited has informed the Exchange about the recordings.
Corporate Actions

No Upcoming Board Meetings

No Dividend history available

No Splits history available

No Bonus history available

No Rights history available
Quality key factors
Valuation key factors
Technicals key factors
 Technical Indicator Scale: Bearish, Mildly Bearish, Sideways, Mildly Bullish, Bullish Turned
 Shareholding Snapshot : Mar 2026
Shareholding Compare (%holding)
Promoters
None
Held by 0 Schemes
Held by 3 FIIs (0.86%)
K Manikandan (36.68%)
L7 Hitech Private Limited (1.43%)
20.26%
Quarterly Results Snapshot (Standalone) - Mar'26 - QoQ

QoQ Growth in quarter ended Mar 2026 is 36.13% vs -32.99% in Dec 2025
QoQ Growth in quarter ended Mar 2026 is 296.67% vs -78.16% in Dec 2025
Half Yearly Results Snapshot (Standalone) - Sep'25
Not Applicable: The company has declared_date for only one period
Not Applicable: The company has declared_date for only one period
Nine Monthly Results Snapshot (Standalone) - Dec'25
Not Applicable: The company has declared_date for only one period
Not Applicable: The company has declared_date for only one period
Annual Results Snapshot (Standalone) - Mar'26

YoY Growth in year ended Mar 2026 is -23.22% vs 89.30% in Mar 2025
YoY Growth in year ended Mar 2026 is -32.82% vs 81.36% in Mar 2025
About Glottis Ltd

Company Coordinates


