
Compare Goenka Business with Similar Stocks
Dashboard
Weak Long Term Fundamental Strength with an average Return on Equity (ROE) of 3.52%
- Poor long term growth as Net Sales has grown by an annual rate of -3.34%
With a growth in Net Profit of 59.18%, the company declared Very Positive results in Mar 26
With ROE of 15.6, it has a Very Attractive valuation with a 0.4 Price to Book Value
Majority shareholders : Non Institution
Stock DNA
Non Banking Financial Company (NBFC)
INR 13 Cr (Micro Cap)
3.00
21
0.00%
0.00
15.61%
0.44
Total Returns (Price + Dividend) 
Goenka Business for the last several years.
Risk Adjusted Returns v/s
Returns Beta

News
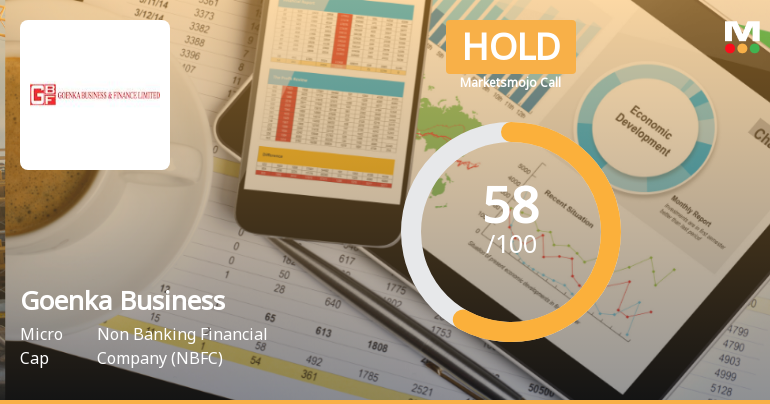
Goenka Business & Finance Ltd Upgraded to Hold by MarketsMOJO on Improving Technicals and Financials
Goenka Business & Finance Ltd, a micro-cap player in the Non Banking Financial Company (NBFC) sector, has seen its investment rating upgraded from Sell to Hold as of 14 July 2026. This revision reflects a combination of improved technical indicators, robust recent financial results, and attractive valuation metrics, despite some lingering concerns over long-term fundamentals.
Read full news article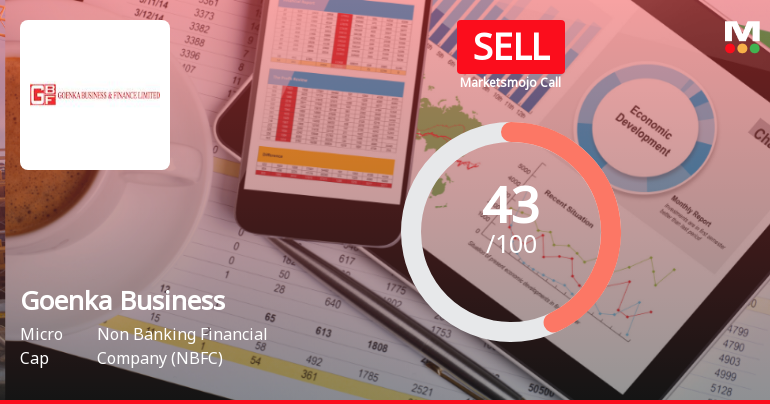
Goenka Business & Finance Ltd Downgraded to Sell Amid Mixed Financial and Technical Signals
Goenka Business & Finance Ltd, a micro-cap player in the Non Banking Financial Company (NBFC) sector, has seen its investment rating downgraded from Hold to Sell as of 6 July 2026. This change is primarily driven by a deterioration in technical indicators, despite the company reporting very positive quarterly financial results for Q4 FY25-26. The downgrade reflects a nuanced assessment across four key parameters: Quality, Valuation, Financial Trend, and Technicals.
Read full news article
Goenka Business & Finance Ltd Upgraded to Hold on Technical and Financial Improvements
Goenka Business & Finance Ltd has seen its investment rating upgraded from Sell to Hold, driven primarily by a shift in technical indicators and a marked improvement in recent financial results. The company’s Mojo Score rose to 58.0, reflecting a more balanced outlook amid mixed long-term fundamentals and encouraging short-term trends.
Read full news article Announcements
Appointment of Company Secretary and Compliance Officer
17-Jul-2026 | Source : BSEIntimation of Appointment of Ms. Priya Jain as Company Secretary and Compliance officer of the company.
Announcement under Regulation 30 (LODR)-Award_of_Order_Receipt_of_Order
02-Jul-2026 | Source : BSEIntimation Under Regulation 30
Closure of Trading Window
01-Jul-2026 | Source : BSEClosure of Trading Window_30.06.2026
Corporate Actions

No Upcoming Board Meetings

No Dividend history available

No Splits history available

No Bonus history available

No Rights history available
Quality key factors
Valuation key factors
Technicals key factors
 Technical Indicator Scale: Bearish, Mildly Bearish, Sideways, Mildly Bullish, Bullish Turned
 Shareholding Snapshot : Mar 2026
Shareholding Compare (%holding)
Non Institution
None
Held by 0 Schemes
Held by 0 FIIs
None
Evergrowing Iron And Finvest Ltd. (9.23%)
65.63%
Quarterly Results Snapshot (Standalone) - Mar'26 - QoQ

QoQ Growth in quarter ended Mar 2026 is -55.95% vs 161.03% in Dec 2025
QoQ Growth in quarter ended Mar 2026 is 59.18% vs 235.53% in Dec 2025
Half Yearly Results Snapshot (Standalone) - Sep'25
Growth in half year ended Sep 2025 is -22.97% vs 6.63% in Sep 2024
Growth in half year ended Sep 2025 is -2,400.00% vs 233.33% in Sep 2024
Nine Monthly Results Snapshot (Standalone) - Dec'25

YoY Growth in nine months ended Dec 2025 is 99.82% vs -10.55% in Dec 2024
YoY Growth in nine months ended Dec 2025 is 159.68% vs -144.60% in Dec 2024
Annual Results Snapshot (Standalone) - Mar'26
YoY Growth in year ended Mar 2026 is 109.28% vs -12.72% in Mar 2025
YoY Growth in year ended Mar 2026 is 894.83% vs -126.48% in Mar 2025
About Goenka Business & Finance Ltd

Company Coordinates


