
Compare Gokul Refoils with Similar Stocks
Dashboard
Weak Long Term Fundamental Strength with a -6.02% CAGR growth in Operating Profits over the last 5 years
- Low ability to service debt as the company has a high Debt to EBITDA ratio of 10.57 times
- The company has been able to generate a Return on Equity (avg) of 6.31% signifying low profitability per unit of shareholders funds
Flat results in Mar 26
Below par performance in long term as well as near term
Total Returns (Price + Dividend) 
Latest dividend: 0.21999999999999997 per share ex-dividend date: Sep-16-2011
Risk Adjusted Returns v/s
Returns Beta

News
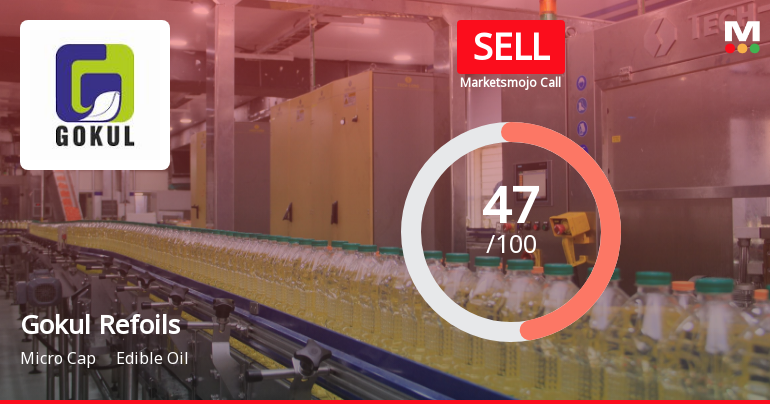
Gokul Refoils and Solvent Ltd is Rated Sell
Gokul Refoils and Solvent Ltd is rated Sell by MarketsMOJO, with this rating last updated on 01 June 2026. However, the analysis and financial metrics discussed here reflect the company’s current position as of 16 June 2026, providing investors with the latest insights into its fundamentals, valuation, financial trends, and technical outlook.
Read full news article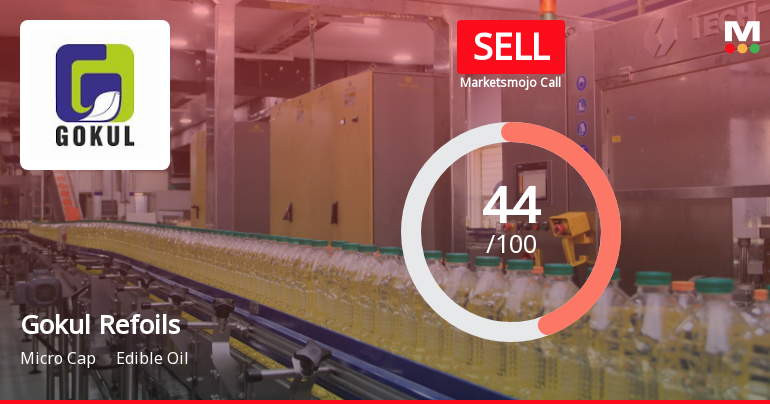
Gokul Refoils and Solvent Ltd is Rated Sell
Gokul Refoils and Solvent Ltd is rated Sell by MarketsMOJO. This rating was last updated on 01 June 2026. However, all fundamentals, returns, and financial metrics discussed here reflect the stock’s current position as of 08 June 2026, providing investors with the latest comprehensive view of the company’s performance and outlook.
Read full news article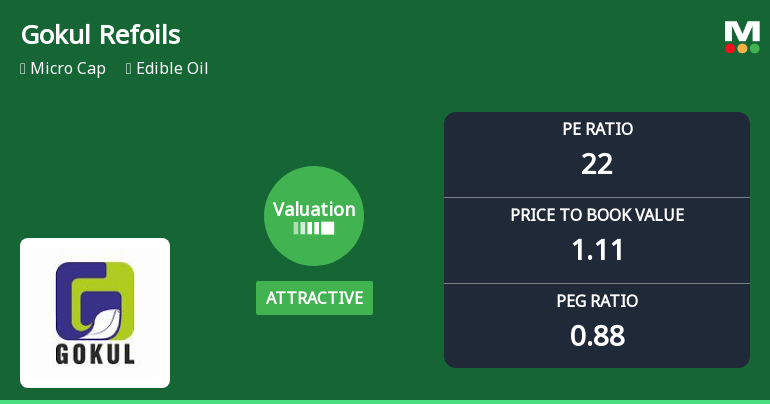
Gokul Refoils and Solvent Ltd: Valuation Shift Enhances Price Attractiveness Amid Market Volatility
Gokul Refoils and Solvent Ltd has witnessed a notable improvement in its valuation parameters, shifting from a very attractive to an attractive rating. This change reflects evolving market perceptions amid a challenging edible oil sector backdrop, with the company’s price-to-earnings (P/E) and price-to-book value (P/BV) ratios signalling enhanced price appeal relative to historical and peer benchmarks.
Read full news article Announcements
Disclosures under Reg. 29(2) of SEBI (SAST) Regulations 2011
17-Jun-2026 | Source : BSEThe Exchange has received the disclosure under Regulation 29(2) of SEBI (Substantial Acquisition of Shares & Takeovers) Regulations 2011 for Bhikhiben Rajput & PACs
Disclosures under Reg. 29(2) of SEBI (SAST) Regulations 2011
17-Jun-2026 | Source : BSEThe Exchange has received the disclosure under Regulation 29(2) of SEBI (Substantial Acquisition of Shares & Takeovers) Regulations 2011 for Bhikhiben Rajput & PACs
Disclosures under Reg. 29(2) of SEBI (SAST) Regulations 2011
16-Jun-2026 | Source : BSEThe Exchange has received the disclosure under Regulation 29(2) of SEBI (Substantial Acquisition of Shares & Takeovers) Regulations 2011 for Bhikhiben Rajput & PACs
Corporate Actions

No Upcoming Board Meetings

Gokul Refoils and Solvent Ltd has declared 11% dividend, ex-date: 16 Sep 11

Gokul Refoils and Solvent Ltd has announced 2:10 stock split, ex-date: 14 Oct 09

No Bonus history available

No Rights history available
Quality key factors
Valuation key factors
Technicals key factors
 Technical Indicator Scale: Bearish, Mildly Bearish, Sideways, Mildly Bullish, Bullish Turned
 Shareholding Snapshot : Mar 2026
Shareholding Compare (%holding)
Promoters
None
Held by 0 Schemes
Held by 3 FIIs (0.27%)
Balvantsinh Chandansinh Rajput (24.63%)
Ridhikripa Trading Private Limited (2.01%)
10.23%
Quarterly Results Snapshot (Consolidated) - Mar'26 - QoQ

QoQ Growth in quarter ended Mar 2026 is -1.84% vs 1.22% in Dec 2025
QoQ Growth in quarter ended Mar 2026 is 11.43% vs 49.15% in Dec 2025
Half Yearly Results Snapshot (Consolidated) - Sep'25

Growth in half year ended Sep 2025 is 20.99% vs 8.49% in Sep 2024
Growth in half year ended Sep 2025 is -2.77% vs 449.77% in Sep 2024
Nine Monthly Results Snapshot (Consolidated) - Dec'25
YoY Growth in nine months ended Dec 2025 is 15.61% vs 14.14% in Dec 2024
YoY Growth in nine months ended Dec 2025 is 54.59% vs 5,546.67% in Dec 2024
Annual Results Snapshot (Consolidated) - Mar'26
YoY Growth in year ended Mar 2026 is 17.36% vs 16.26% in Mar 2025
YoY Growth in year ended Mar 2026 is 24.78% vs 718.23% in Mar 2025
About Gokul Refoils and Solvent Ltd

Company Coordinates


