
Compare Golden Carpets with Similar Stocks
Stock DNA
Furniture, Home Furnishing
INR 8 Cr (Micro Cap)
NA (Loss Making)
NA
0.00%
-4.58
15.00%
-8.25
Total Returns (Price + Dividend) 
Golden Carpets for the last several years.
Risk Adjusted Returns v/s
Returns Beta

News
When is the next results date for Golden Carpets Ltd?
The next results date for Golden Carpets Ltd is scheduled for 29 May 2026....
Read full news article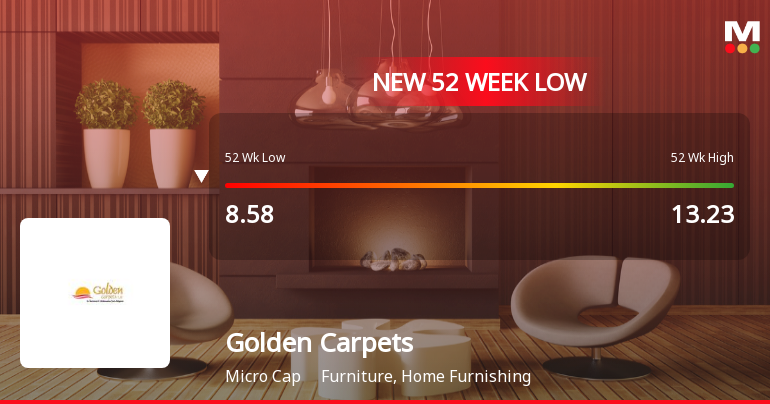
Golden Carpets Ltd Stock Falls to 52-Week Low of Rs.8.36
Golden Carpets Ltd, a micro-cap player in the Furniture and Home Furnishing sector, touched a fresh 52-week low of Rs.8.36 today, marking a significant decline in its stock price amid persistent underperformance relative to its sector and broader market indices.
Read full news article Announcements
Announcement under Regulation 30 (LODR)-Newspaper Publication
30-May-2026 | Source : BSEWe wish to inform your esteemed organization that the Company has published the Audited Financial Results for the quarter and financial year ended 31st March 2026 on 30th May 2026 in the following newspapers: 1. Business Standard (English Language) 2. Mana Telangana (Regional Language)
Board Meeting Outcome for Outcome Of Board Meeting Held On 29Th May 2026 And Audited Financial Results For The Quarter And Year Ended 31St March 2026
29-May-2026 | Source : BSEPursuant to Regulation 33 of SEBI Listing Regulations the Board of Directors of the Company has considered and approved the Audited Financial Results for the quarter and financial year ended 31st March 2026 along with Statement of Assets and Liabilities and Cash Flow Statement and took note of the Auditors Report issued by M/s. Sathuluri & Co. Chartered Accountants in respect of Financial Results of the Company for the financial year ended 31st March 2026. Further the Company has appointed M/s. Atluri Ramesh and Associates Company Secretaries as the Secretarial Auditor of the Company for the Financial Year 2025-26
Audited Financial Results For The Quarter And Year Ended 31St March 2026
29-May-2026 | Source : BSEThe Board of Directors of the Company have interallia: 1. Considered and approved the Audited Financial Results for the Quarter and Year ended 31st March 2026 2. Took note of the Auditors Report on the Financial Results for the Quarter and Year ended 31st March 2026
Corporate Actions

No Upcoming Board Meetings

No Dividend history available

No Splits history available

No Bonus history available

No Rights history available
Quality key factors
Valuation key factors
Technicals key factors
 Technical Indicator Scale: Bearish, Mildly Bearish, Sideways, Mildly Bullish, Bullish Turned
 Shareholding Snapshot : Mar 2026
Shareholding Compare (%holding)
Promoters
None
Held by 0 Schemes
Held by 0 FIIs
Srikrishna Naik (42.44%)
Ch Kiron (2.16%)
24.63%
Quarterly Results Snapshot (Standalone) - Mar'26 - QoQ

QoQ Growth in quarter ended Mar 2026 is 650.00% vs -96.15% in Dec 2025
QoQ Growth in quarter ended Mar 2026 is 104.55% vs -833.33% in Dec 2025
Half Yearly Results Snapshot (Standalone) - Sep'22
Growth in half year ended Sep 2022 is 47.06% vs -43.33% in Sep 2021
Growth in half year ended Sep 2022 is 47.62% vs -110.00% in Sep 2021
Nine Monthly Results Snapshot (Standalone) - Mar'23
YoY Growth in nine months ended Mar 2023 is 2.56% vs -25.00% in Dec 2021
YoY Growth in nine months ended Mar 2023 is 22.22% vs -125.00% in Dec 2021
Annual Results Snapshot (Standalone) - Mar'26
YoY Growth in year ended Mar 2026 is 20.25% vs 17.91% in Mar 2025

YoY Growth in year ended Mar 2026 is -77.78% vs 55.00% in Mar 2025
About Golden Carpets Ltd

Company Coordinates


