
Compare Golub Capital BDC, Inc. with Similar Stocks
Dashboard
1
Strong Long Term Fundamental Strength with a 80.30% CAGR growth in Operating Profits
2
Healthy long term growth as Operating profit has grown by an annual rate of 80.30%
3
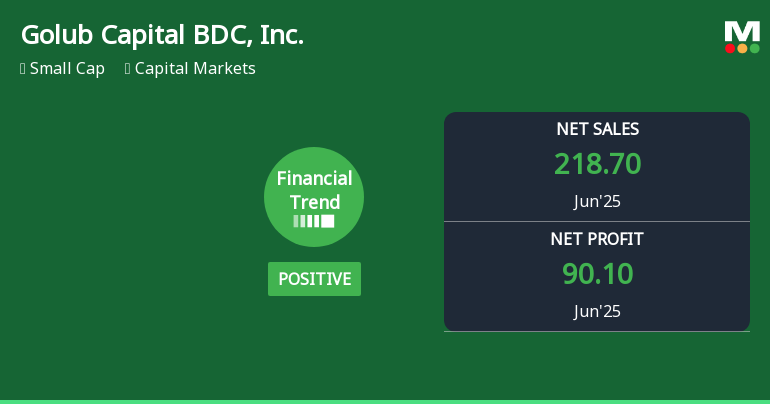
Flat results in Jun 25
4
With ROE of 7.29%, it has a very attractive valuation with a 1.00 Price to Book Value
5
Consistent Underperformance against the benchmark over the last 3 years
Total Returns (Price + Dividend) 
TimePeriod
Price Return
Dividend Return
Total Return
3 Months
-12.41%
0%
-12.41%
6 Months
-13.34%
0%
-13.34%
1 Year
-18.53%
0%
-18.53%
2 Years
-2.9%
0%
-2.9%
3 Years
-3.97%
0%
-3.97%
4 Years
-15.47%
0%
-15.47%
5 Years
5.75%
0%
5.75%
Golub Capital BDC, Inc. for the last several years.
Risk Adjusted Returns v/s
News
Golub Capital BDC, Inc. Experiences Revision in Stock Evaluation Amid Financial Performance Trends
Golub Capital BDC, Inc. reported strong financial results for the quarter ending June 2025, with significant growth in operating cash flow, pre-tax profit, and net sales. However, rising interest expenses and raw material costs, along with a high debt-equity ratio, indicate potential challenges ahead for the company.
Read full news article Announcements

No announcement available
Corporate Actions
No corporate action available
Quality key factors
Factor
Value
Sales Growth (5y)
25.33%
EBIT Growth (5y)
80.30%
EBIT to Interest (avg)
3.80
Debt to EBITDA (avg)
Negative Net Debt
Net Debt to Equity (avg)
0
Sales to Capital Employed (avg)
0
Tax Ratio
Tax Ratio is Negative%
Dividend Payout Ratio
113.70%
Pledged Shares
0
Institutional Holding
47.94%
ROCE (avg)
16.90%
ROE (avg)
10.52%
Valuation key factors
Factor
Value
P/E Ratio
14
Industry P/E
Price to Book Value
1.00
EV to EBIT
6.68
EV to EBITDA
6.68
EV to Capital Employed
1.00
EV to Sales
5.15
PEG Ratio
NA
Dividend Yield
5.94%
ROCE (Latest)
14.92%
ROE (Latest)
7.29%
Technicals key factors
Indicator
Weekly
Monthly
MACD
Bearish
Bearish
RSI
No Signal
No Signal
Bollinger Bands
Bearish
Bearish
Moving Averages
Bearish (Daily)
KST
Mildly Bullish
Bearish
Dow Theory
Mildly Bearish
Mildly Bearish
OBV
Mildly Bearish
Mildly Bearish
 Technical Indicator Scale: Bearish, Mildly Bearish, Sideways, Mildly Bullish, Bullish Turned
 Shareholding Snapshot : Sep 2025
Shareholding Compare (%holding)
Majority shareholders
Domestic Funds
Domestic Funds
Held in 21 Schemes (7.98%)
Foreign Institutions
Held by 57 Foreign Institutions (7.59%)
Strategic Entities with highest holding
Highest Public shareholder
Quarterly Results Snapshot (Consolidated) - Jun'25 - YoY
Jun'25
Jun'24
Change(%)
Net Sales
218.70
139.80
56.44%
Operating Profit (PBDIT) excl Other Income
137.10
71.70
91.21%
Interest
70.70
60.10
17.64%
Exceptional Items
0.00
0.00
Consolidate Net Profit
90.10
9.30
868.82%
Operating Profit Margin (Excl OI)
626.80%
512.90%
11.39%
USD in Million.

Net Sales
YoY Growth in quarter ended Jun 2025 is 56.44% vs 25.16% in Jun 2024
Consolidated Net Profit
YoY Growth in quarter ended Jun 2025 is 868.82% vs -87.26% in Jun 2024
Annual Results Snapshot (Consolidated) - Sep'24
Sep'24
Sep'23
Change(%)
Net Sales
646.70
559.30
15.63%
Operating Profit (PBDIT) excl Other Income
467.00
392.80
18.89%
Interest
212.40
150.60
41.04%
Exceptional Items
0.00
0.00
Consolidate Net Profit
273.80
258.60
5.88%
Operating Profit Margin (Excl OI)
722.10%
702.30%
1.98%
USD in Million.

Net Sales
YoY Growth in year ended Sep 2024 is 15.63% vs 36.95% in Sep 2023
Consolidated Net Profit
YoY Growth in year ended Sep 2024 is 5.88% vs 68.58% in Sep 2023
About Golub Capital BDC, Inc.

Golub Capital BDC, Inc.
Capital Markets
Golub Capital BDC, Inc. is an externally managed, non-diversified closed-end management investment company. The Company invests primarily in senior secured and one-stop loans to United States middle market companies that are sponsored by private equity investors. The Company invests in various industries including diversified/conglomerate service; healthcare, education and childcare; retail stores; electronics; beverage, food and tobacco; leisure, amusement, motion pictures, entertainment; buildings and real estate; aerospace and defense, and insurance. The Company’s investment activities are managed by its investment adviser, GC Advisors LLC.
Company Coordinates
Company Details
200 Park Avenue, 25th Floor , NEW YORK NY : 10106


Registrar Details
InfinHub Market Technologies FZ-LLC, Building-2, Unit 112, Dubai Internet City, Dubai, United Arab Emirates
GET THE MARKETSMOJO APP


Company
Stocks
Portfolio


"Investment in securities markets are subject to market risk. Read all the related documents carefully before investing."